Wouldn’t it be great if you could sign into your WordPress dashboard, click a button, and see many of your website’s most important stats all in one spot?
In MonsterInsights 9.3, you can! Meet your new Overview report with additional metrics tabs. Now, you can customize your analytics dashboard to focus on the exact metrics that matter most to your business.
When you open your WordPress dashboard reports, the first thing you see is your Overview report with your traffic graph. Until now, this graph was limited to showing either sessions or pageviews.
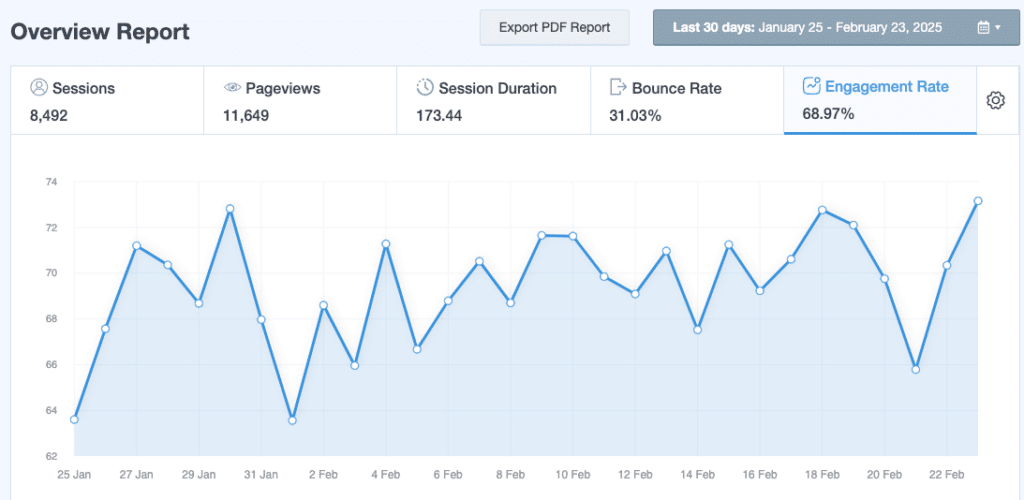
With MonsterInsights 9.3, we’ve completely transformed this experience for all users by adding tabbed metrics that let you customize which data points appear in your overview graph:

Now, you can quickly see a graph of your data not only for page views and sessions, but also for:
- Total users
- Page views per user
- Session duration
- Bounce rate
- New users
- Engagement rate
- Sessions per user
- eCommerce purchases (Pro)
- Revenue per sale (Pro)
- Average revenue per user (Pro)
- Average revenue per session (Pro)
This gives you the flexibility to quickly see the metrics that matter most to your site. Whether you’re focusing on user engagement, content effectiveness, or revenue generation, you now have immediate access to the data you need without switching between multiple reports.
Plus, it helps you spot any anomalies before they become big problems! Promptly spot issues that could mean a problem with your website or your marketing strategy, like a sudden increase in bounce rate, declining session duration, or a jump in page views while total users stays steady.
Getting Started with Tabbed Overview Reports
To start using these new features today, make sure to update your MonsterInsights plugin to the latest version (9.3).
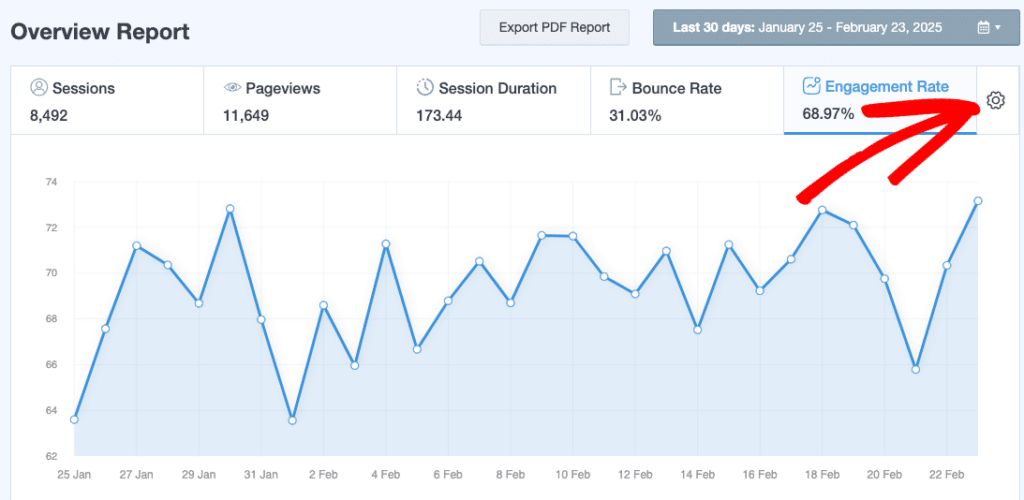
Once updated, simply navigate to Insights » Reports in your WordPress dashboard. In your Overview report, you’ll see a cog icon above the main graph. Click on it to select from any of the available metrics to add to your report:

That’s it! I hope you love adding more metrics to your overview report.
Curious about what else we’ve been up to? Check out our latest releases:
Finally, don’t forget to follow us on YouTube for more helpful reviews, tutorials, and Google Analytics tips.


