As a business owner or marketer, understanding your website’s performance is absolutely crucial for making informed, data-driven decisions that drive real business growth. That’s where Google Analytics reports come in—they’re invaluable tools that give you a wealth of insights into your traffic, user behavior, and so much more.
Now, with the latest version, Google Analytics 4 (or GA4 for short), the reporting capabilities have evolved in some really exciting ways. However, that also made it a little bit more intimidating for both new and returning users. But I’m here to help!
In this guide, I’ll show you the essential Google Analytics reports you need to track, share some of the more advanced features you can use, and, most importantly, show you how to actually use all this data to optimize your site’s performance and grow your business.
My goal is for you to walk away feeling empowered to make smarter, data-driven decisions for your website.
Let’s go.
Table of Contents
- Get to Know the Google Analytics Reports
- Make Google Analytics Reports Work for YOU: Customization Tips
- Advanced Google Analytics Reporting: Explore Reports
- Best Practices and Tips for GA4 Reporting
- Google Analytics Reports in WordPress
- Google Analytics Report FAQ
Get to Know the Google Analytics Reports
First, you’ll want to get to know the standard reports that your Google Analytics property comes with.
In Google Analytics 4, standard reports are grouped into categories that provide a full view of user acquisition, engagement, monetization, and more. I’ll go over each report and its insights so you get a general picture of what each one is for.
One quick note here before I begin: During the setup of your Google Analytics property, there’s a step where Google asks what your business objective is. In order to get the full list of reports I’ll go over below, you’ll need to select Other:
Already created your property and chose a different objective? That’s okay! You can edit the reports that show up in your Google Analytics sidebar any time (and add any you see below that you want) by heading to the GA4 Library:
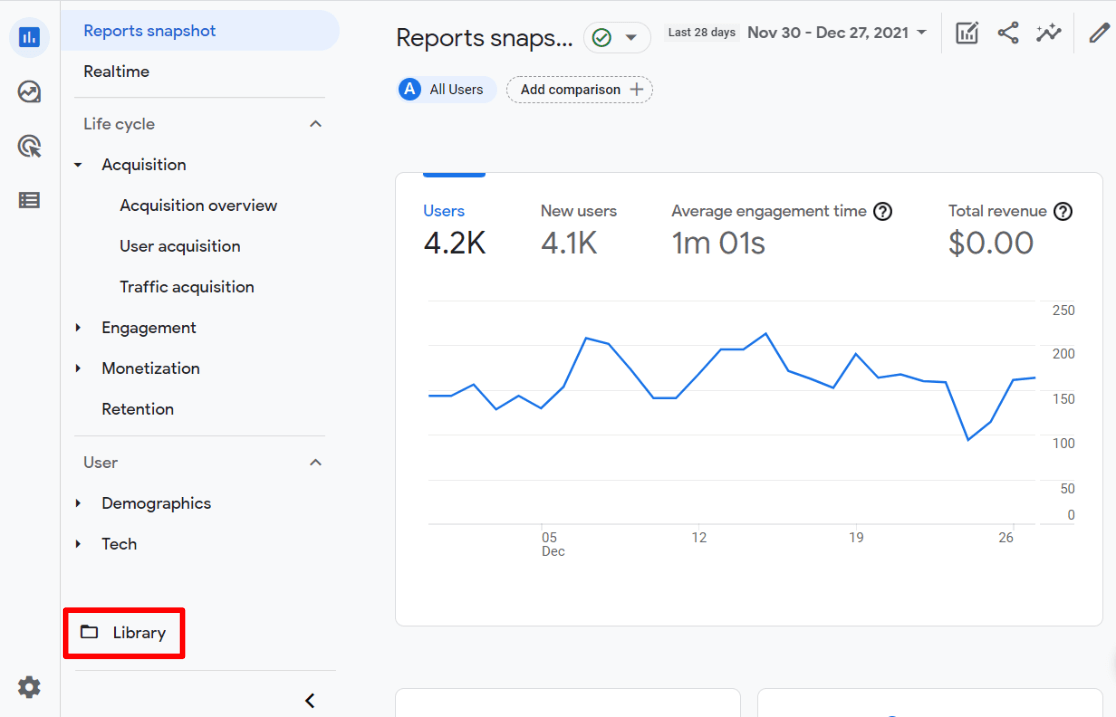
In the Library, you’ll be able to change which reports appear under the different headings in your sidebar.
Google Analytics Standard Reports
Let me walk you through all the standard reports you’ll find in GA4. I know there are quite a few, but don’t worry—I’ll break down exactly what each one means and why it matters for your business.
Let’s start with Acquisition reports (aka how people are finding your site):
Acquisition Overview
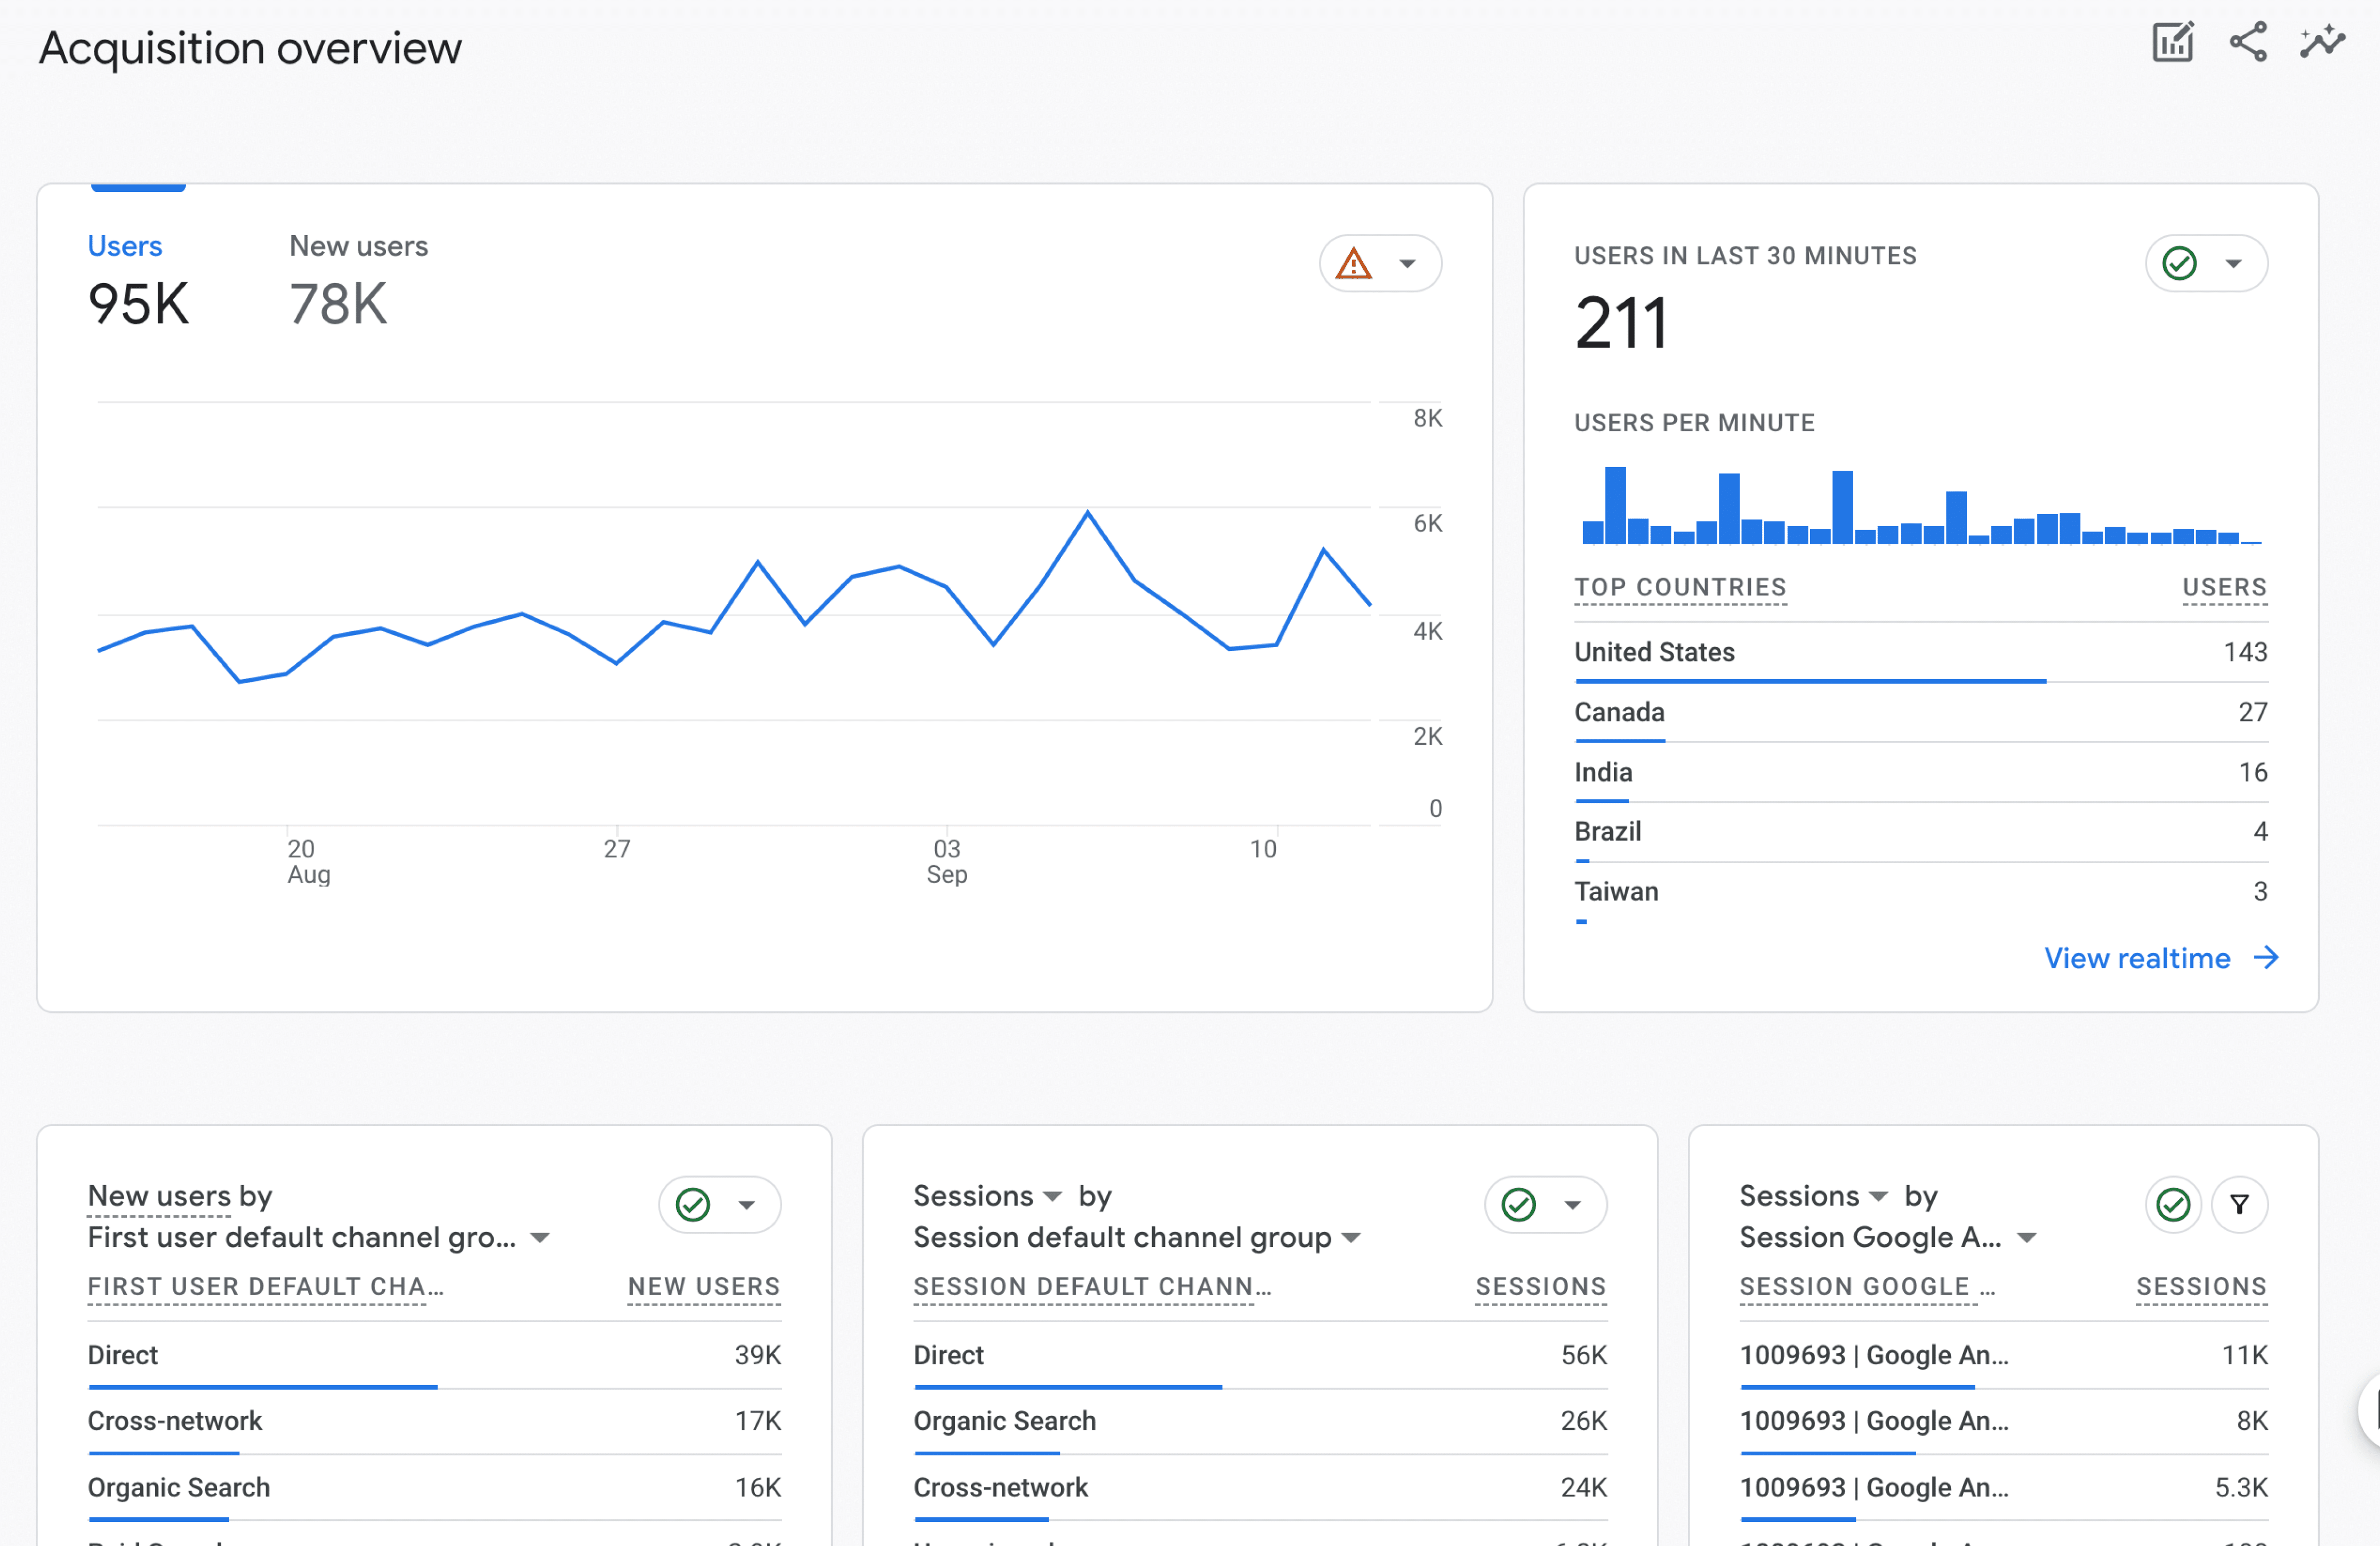
First up is the Acquisition Overview, which I absolutely love because it gives you a bird’s-eye view of where your traffic is coming from. Think of it as your traffic snapshot—are most of your visitors coming from Google searches? Social media? Paid ads? This report will tell you exactly that. Use it for a high-level snapshot of your traffic sources, seeing where users are coming from and giving an initial sense of which channels are most effective.
User Acquisition
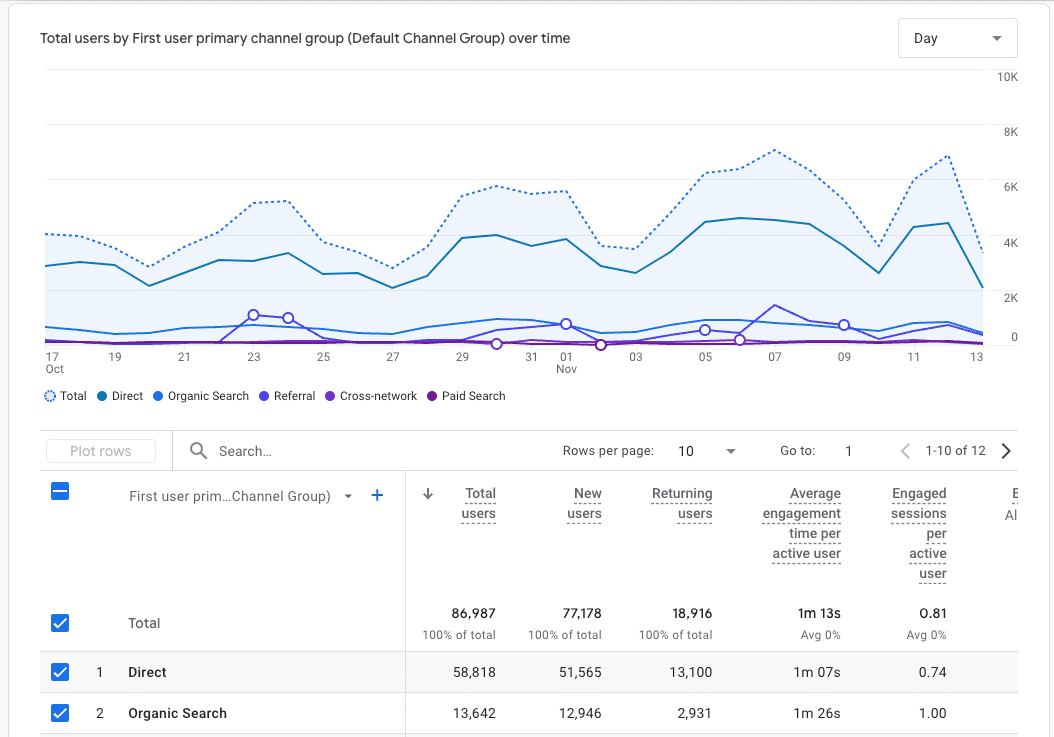
The User Acquisition report focuses specifically on new visitors. I find this incredibly useful for figuring out which of your marketing strategies and tactics are actually working to bring in fresh faces to your site. Look not only at which channel is bringing in the most new users but also at which one is bringing in the most engaged new users.
Traffic Acquisition
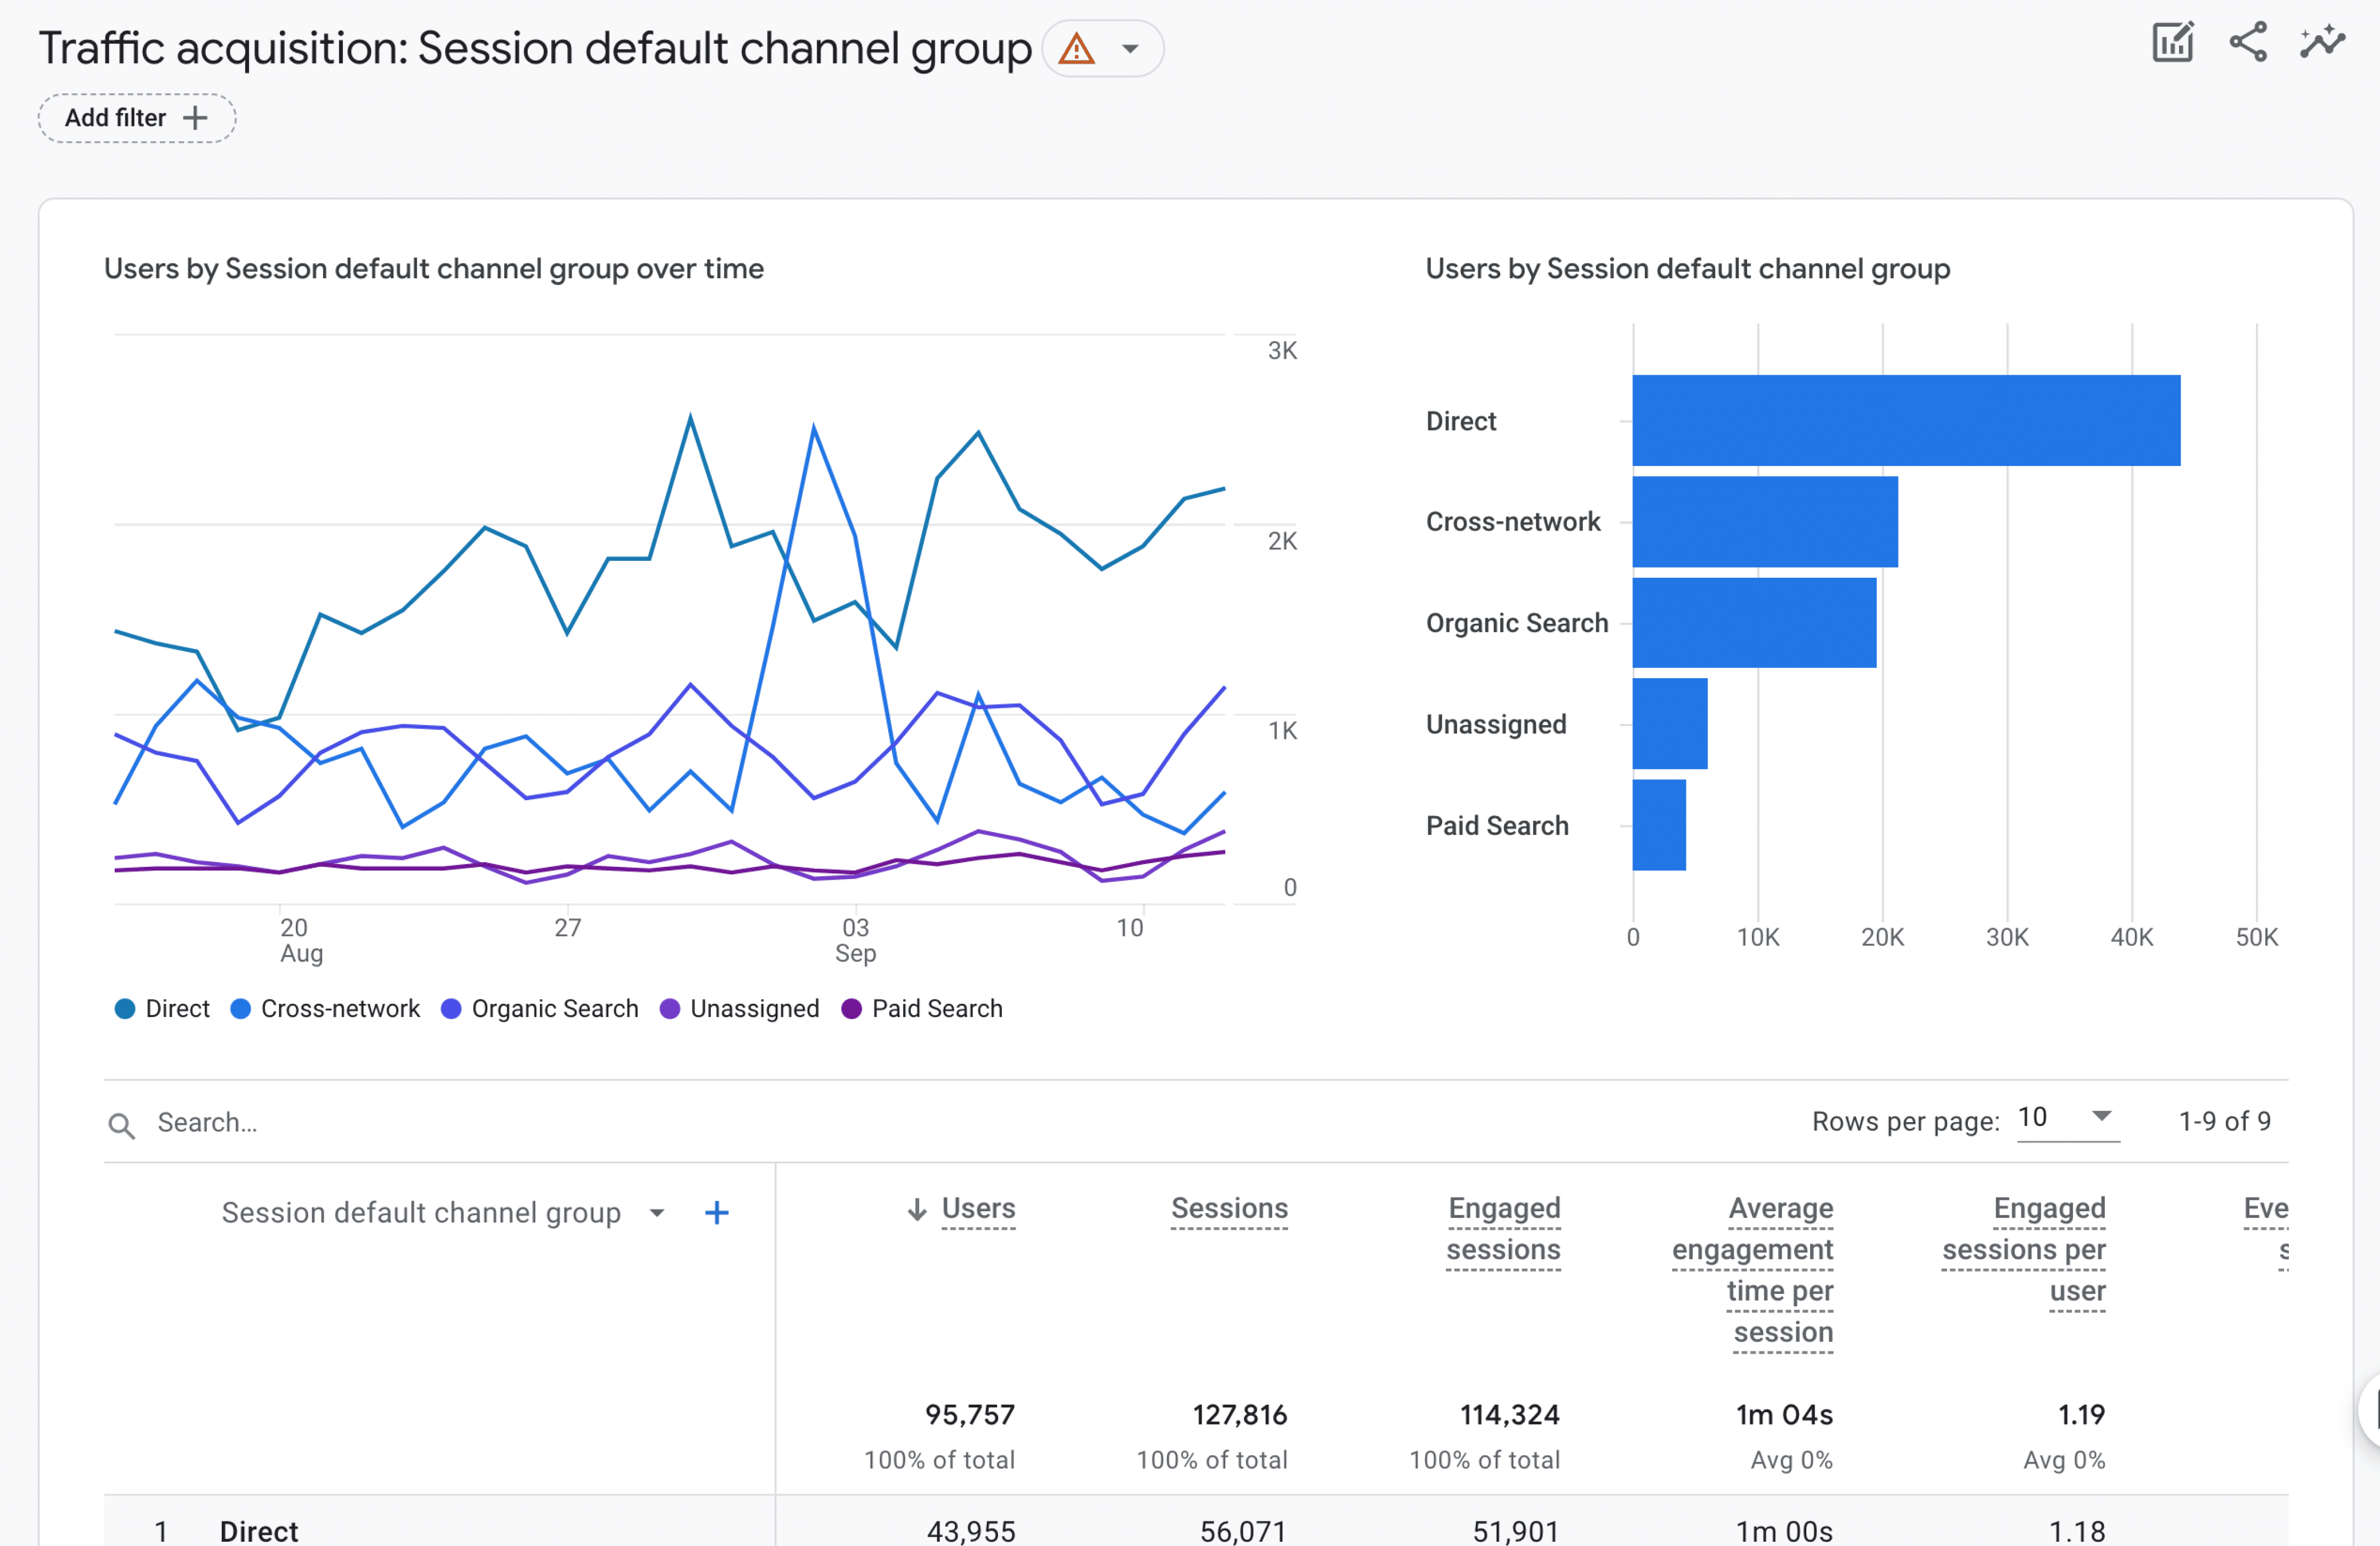
The Traffic Acquisition report is similar, but here’s why it’s special: it shows you both new AND returning visitors, giving you the complete picture of your traffic sources. Here, you can see which channels are sending you the best traffic overall. Which visitors are the most engaged, and which are completing the most conversions (key events)?
User Acquisition Cohorts
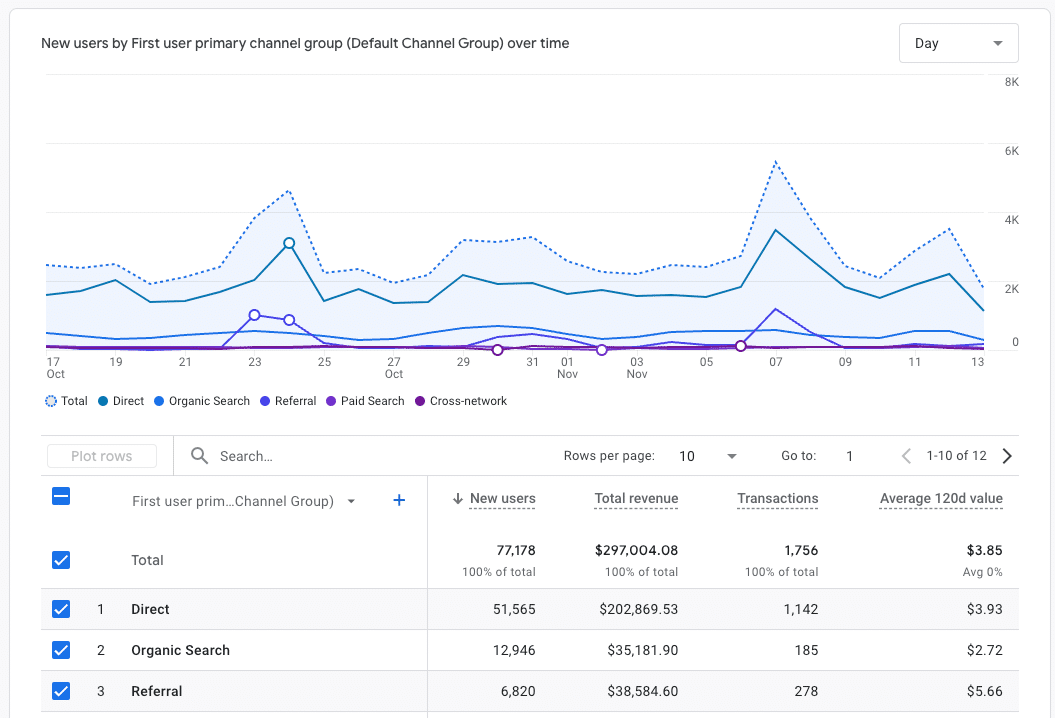
Last in the Acquisition category is the User Acquisition Cohorts report. Now, this one’s really interesting because it groups your users based on when they first visited your site and shows you how valuable they’ve become over the past 120 days. It’s perfect for spotting patterns in how different groups of users behave over time.
Alright, let’s move on to Engagement reports (this is where you’ll see what people are actually doing on your site).
Engagement Overview
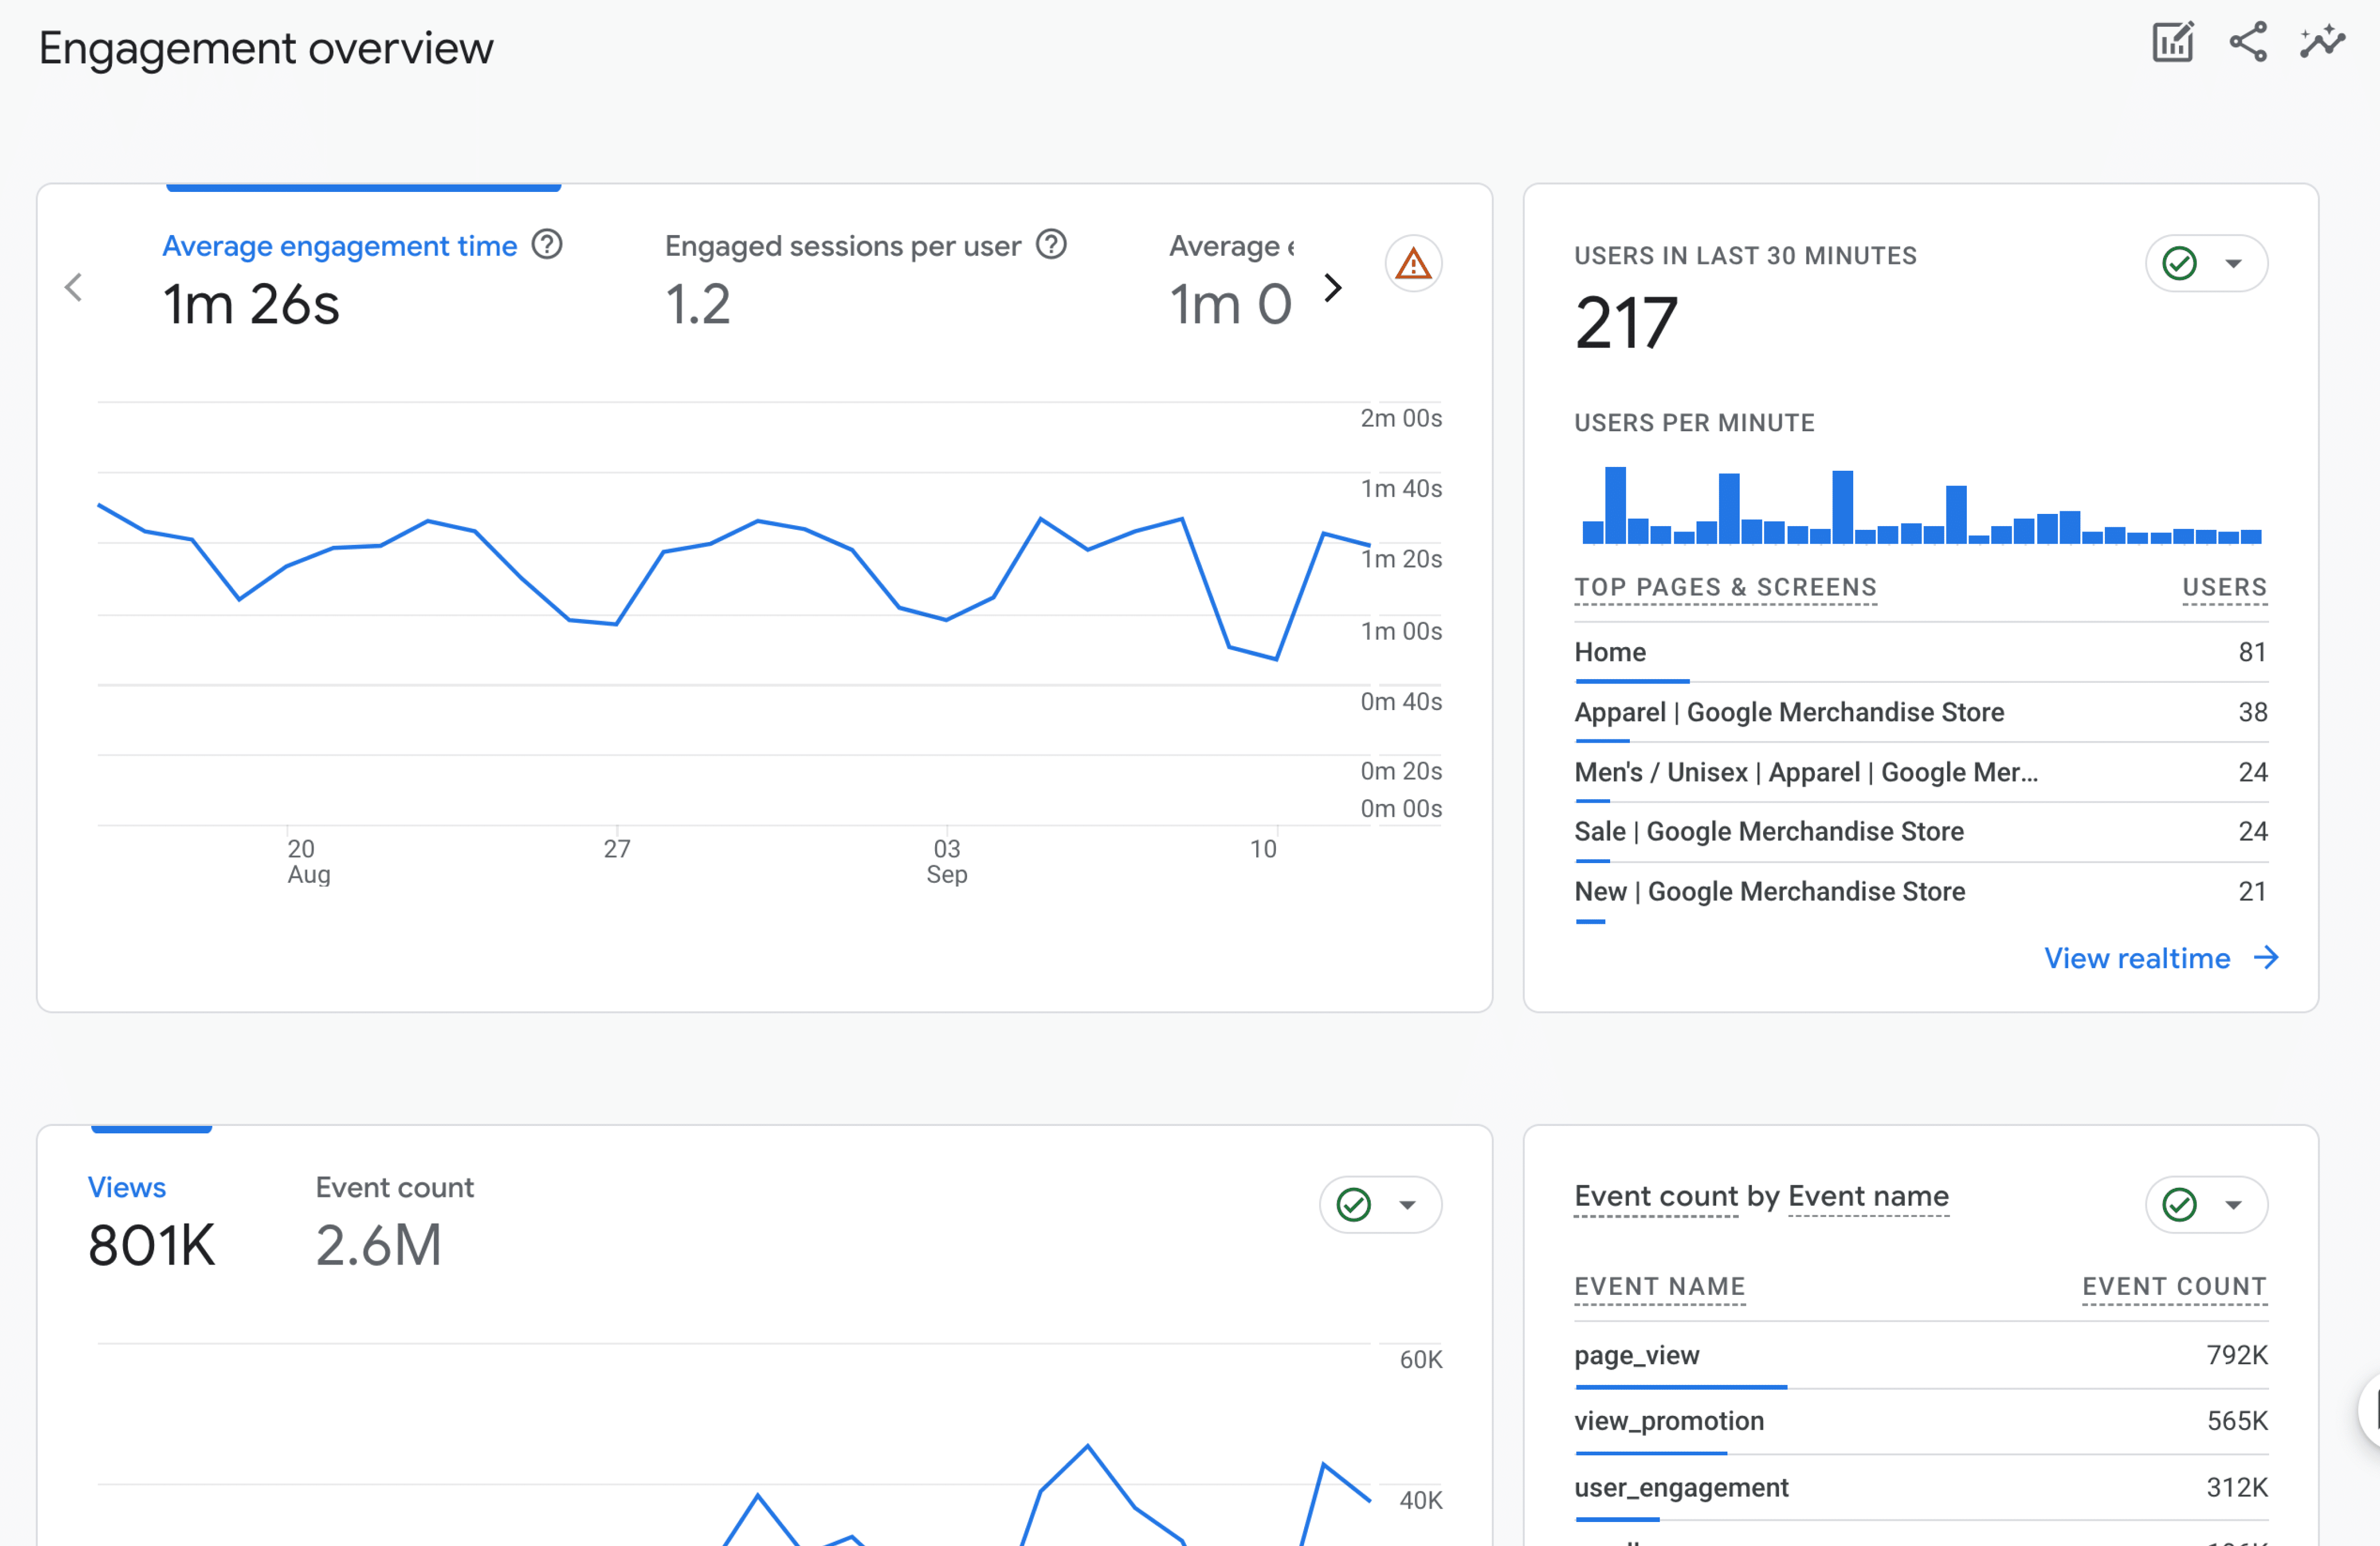
The Engagement Overview is your go-to dashboard for understanding how people interact with your site. Are they sticking around? How long are they staying? It’s all here in easy-to-digest metrics like engagement rate and average engagement time.
Events

The Events report is particularly powerful because it shows you specific actions users take on your site. Whether it’s clicking a button, playing a video, or filling out a form, you’ll see it all here (as long as you have the events set up). I can’t tell you how valuable this is for understanding exactly how people are interacting with your content. However, it’s definitely a report you have to learn how to manipulate for it to really be valuable. I’ll get to how to do that later!
Pages and Screens
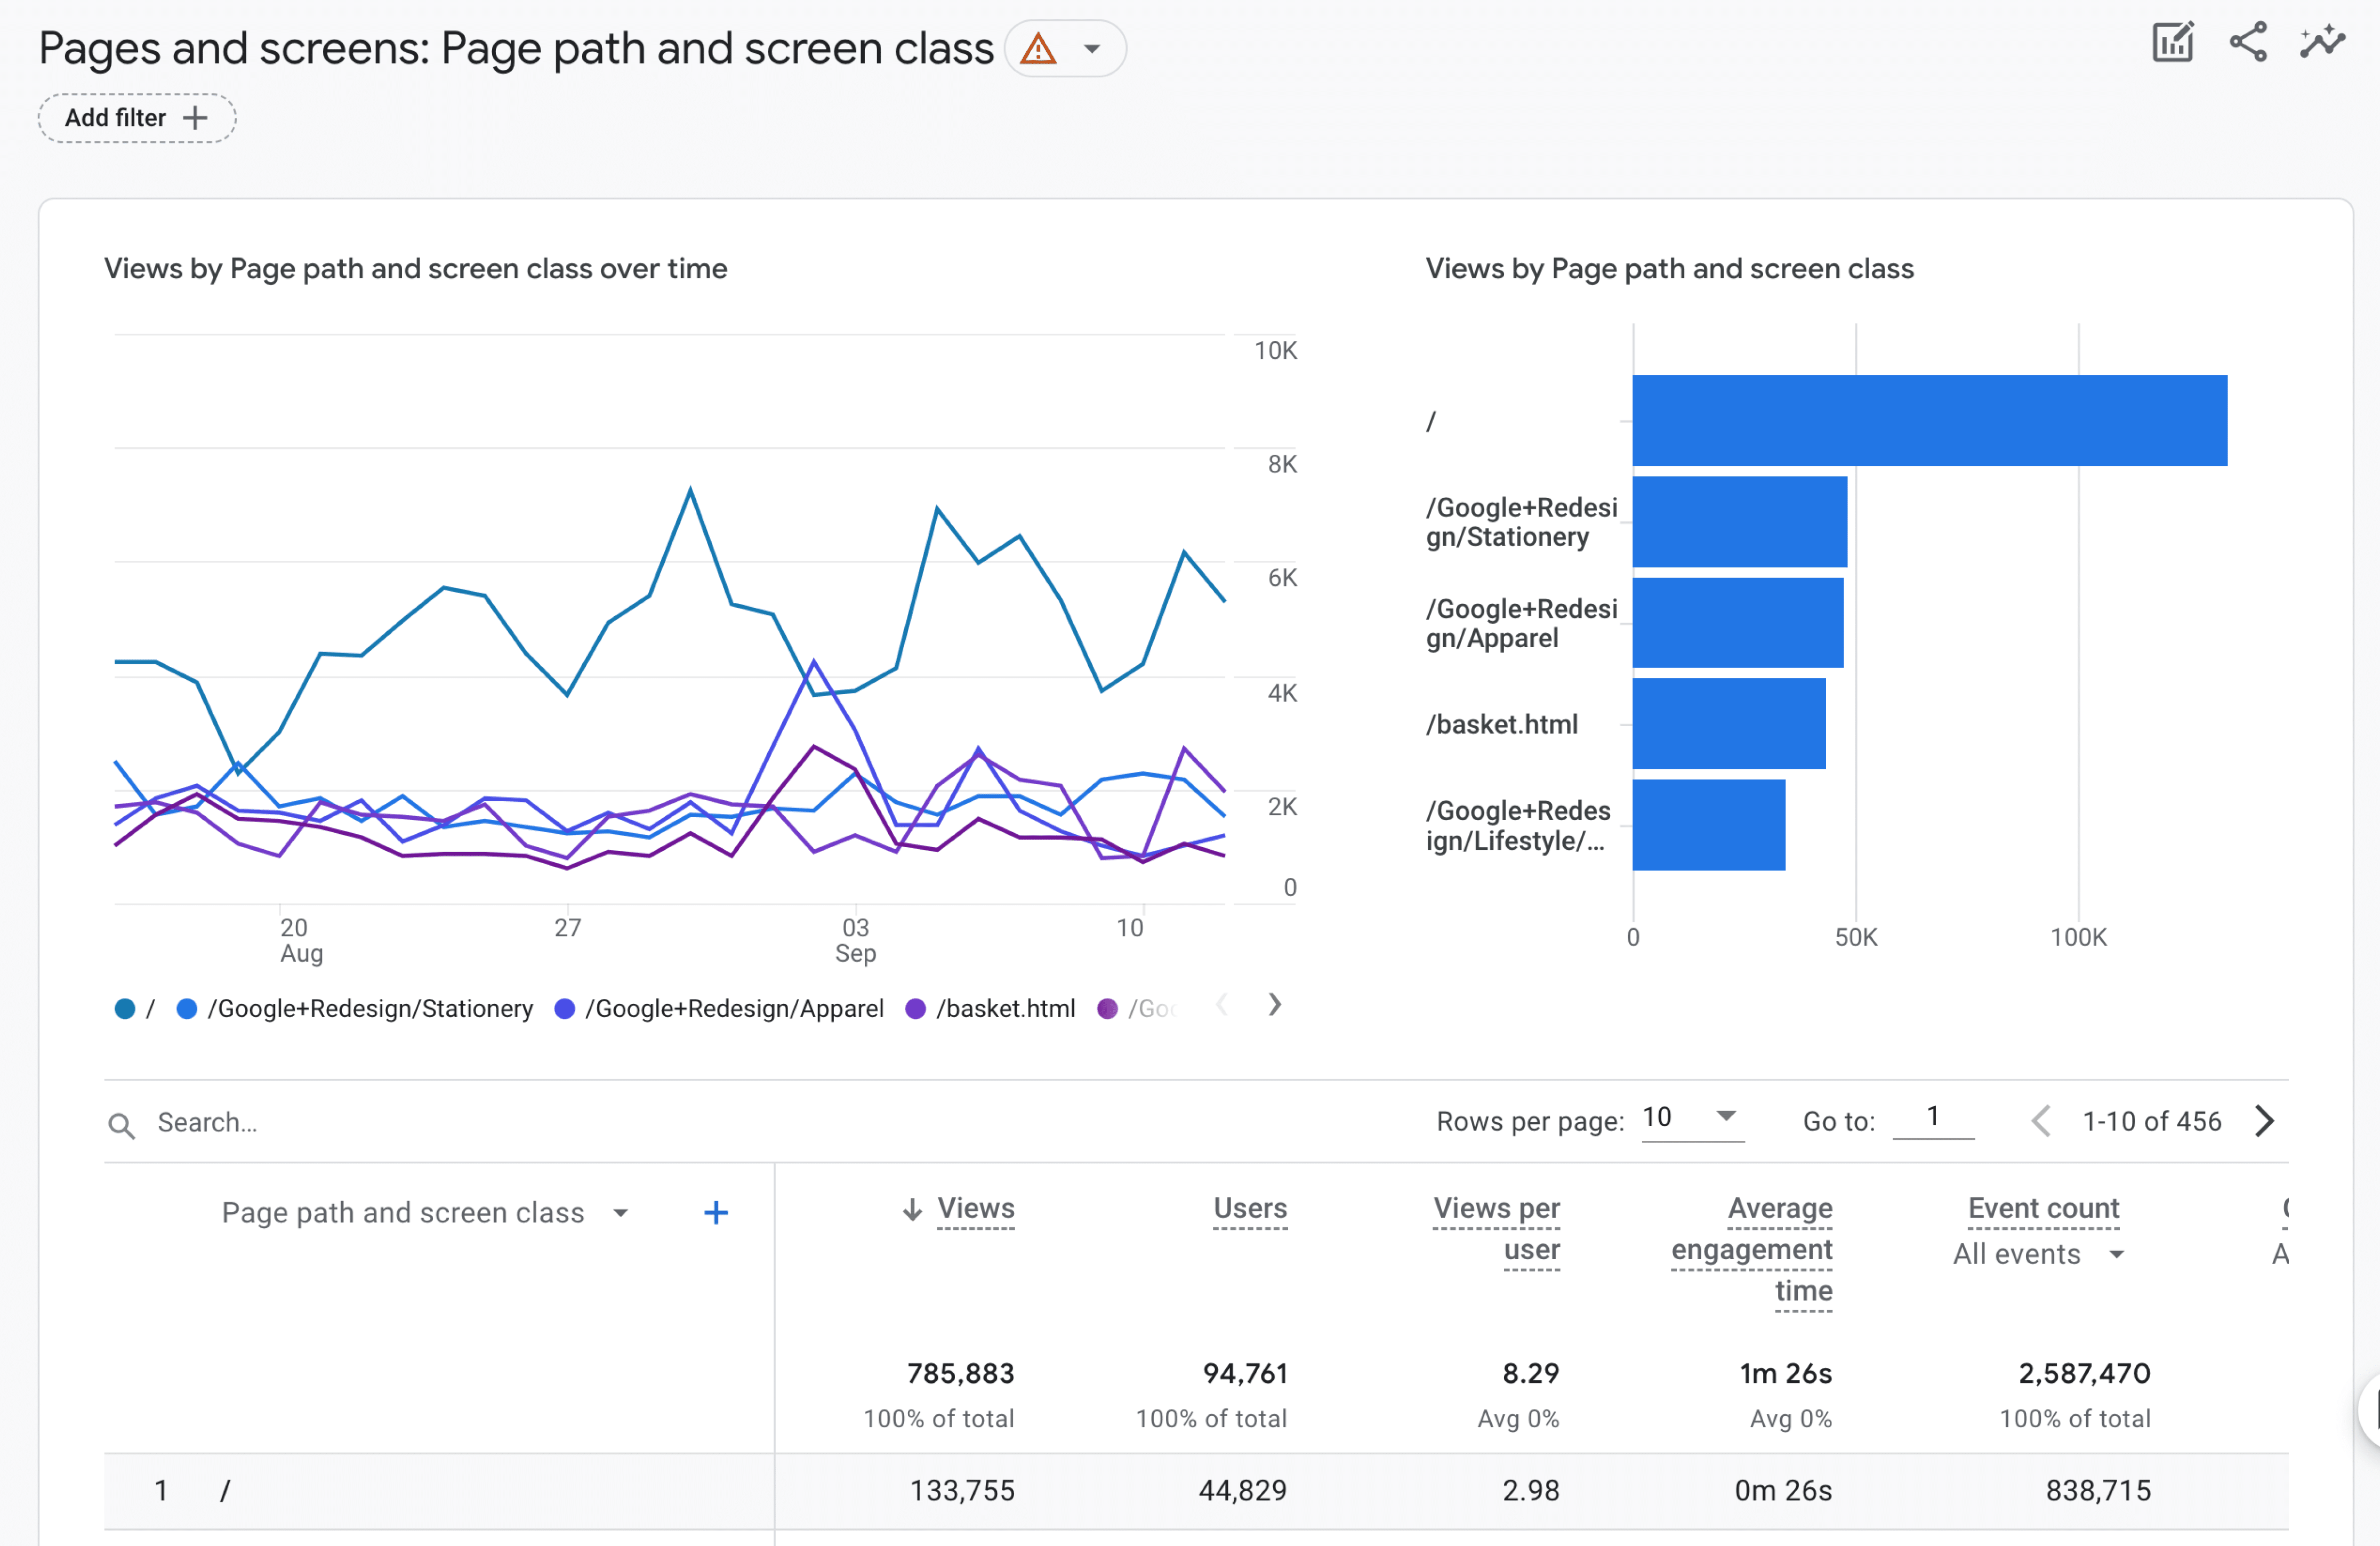
For content performance, you’ll want to check out the Pages and Screens report. This shows you which of your pages and posts are getting the most views (and which ones might need some love). I always look at this when I’m planning content updates or deciding what topics to cover next.
Landing Pages
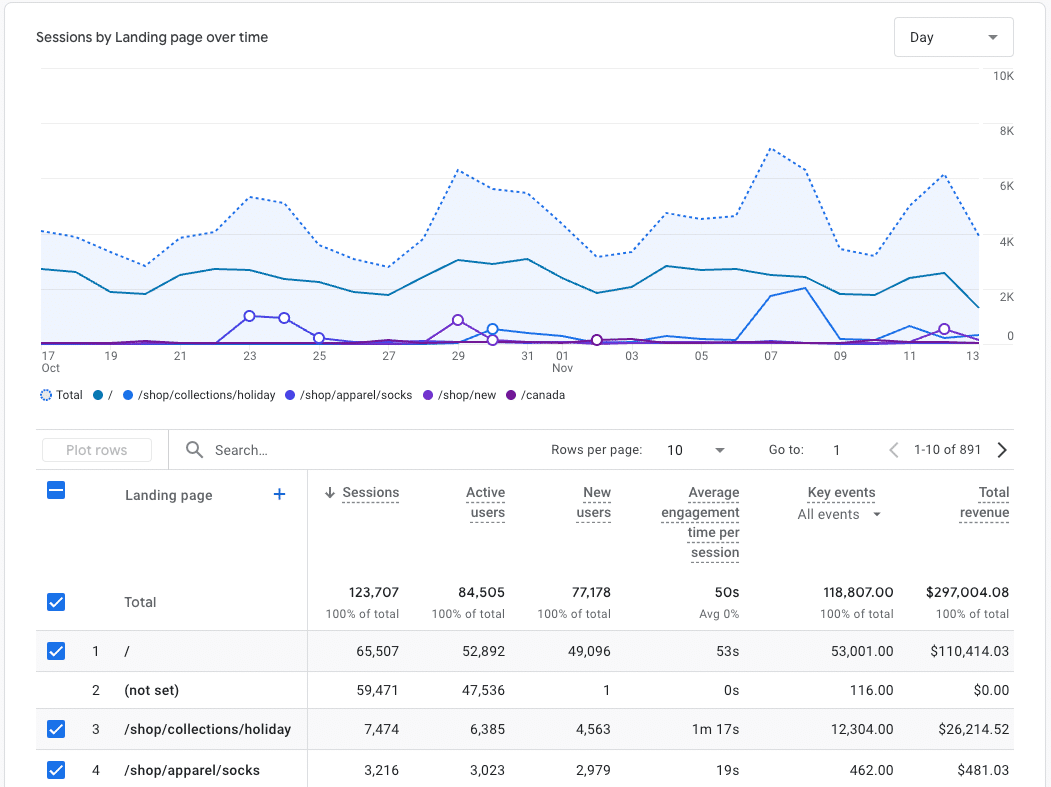
The Landing Pages report is crucial because it shows you where people are entering your site. These pages are your digital front doors, so knowing which ones are most popular helps you optimize them to boost engagement from the start of the visitor journey. This report can also help you see what content is popular and attracting clicks across the web.
Now, let’s talk about money with the Monetization reports (which are especially important if you’re running an eCommerce site).
Monetization Overview
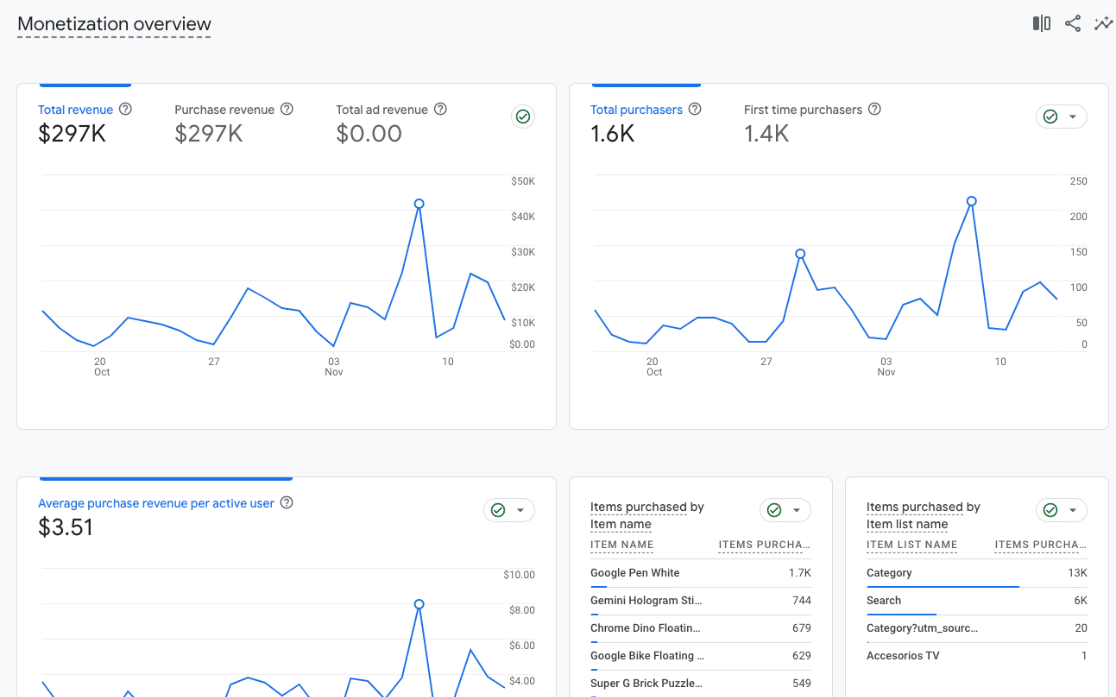
The Monetization Overview gives you the big picture of your revenue situation. How many sales are you making? What’s your total revenue? It’s all right here in one convenient dashboard. Use it to keep a close eye on your revenue flow and top-selling products.
Ecommerce Purchases
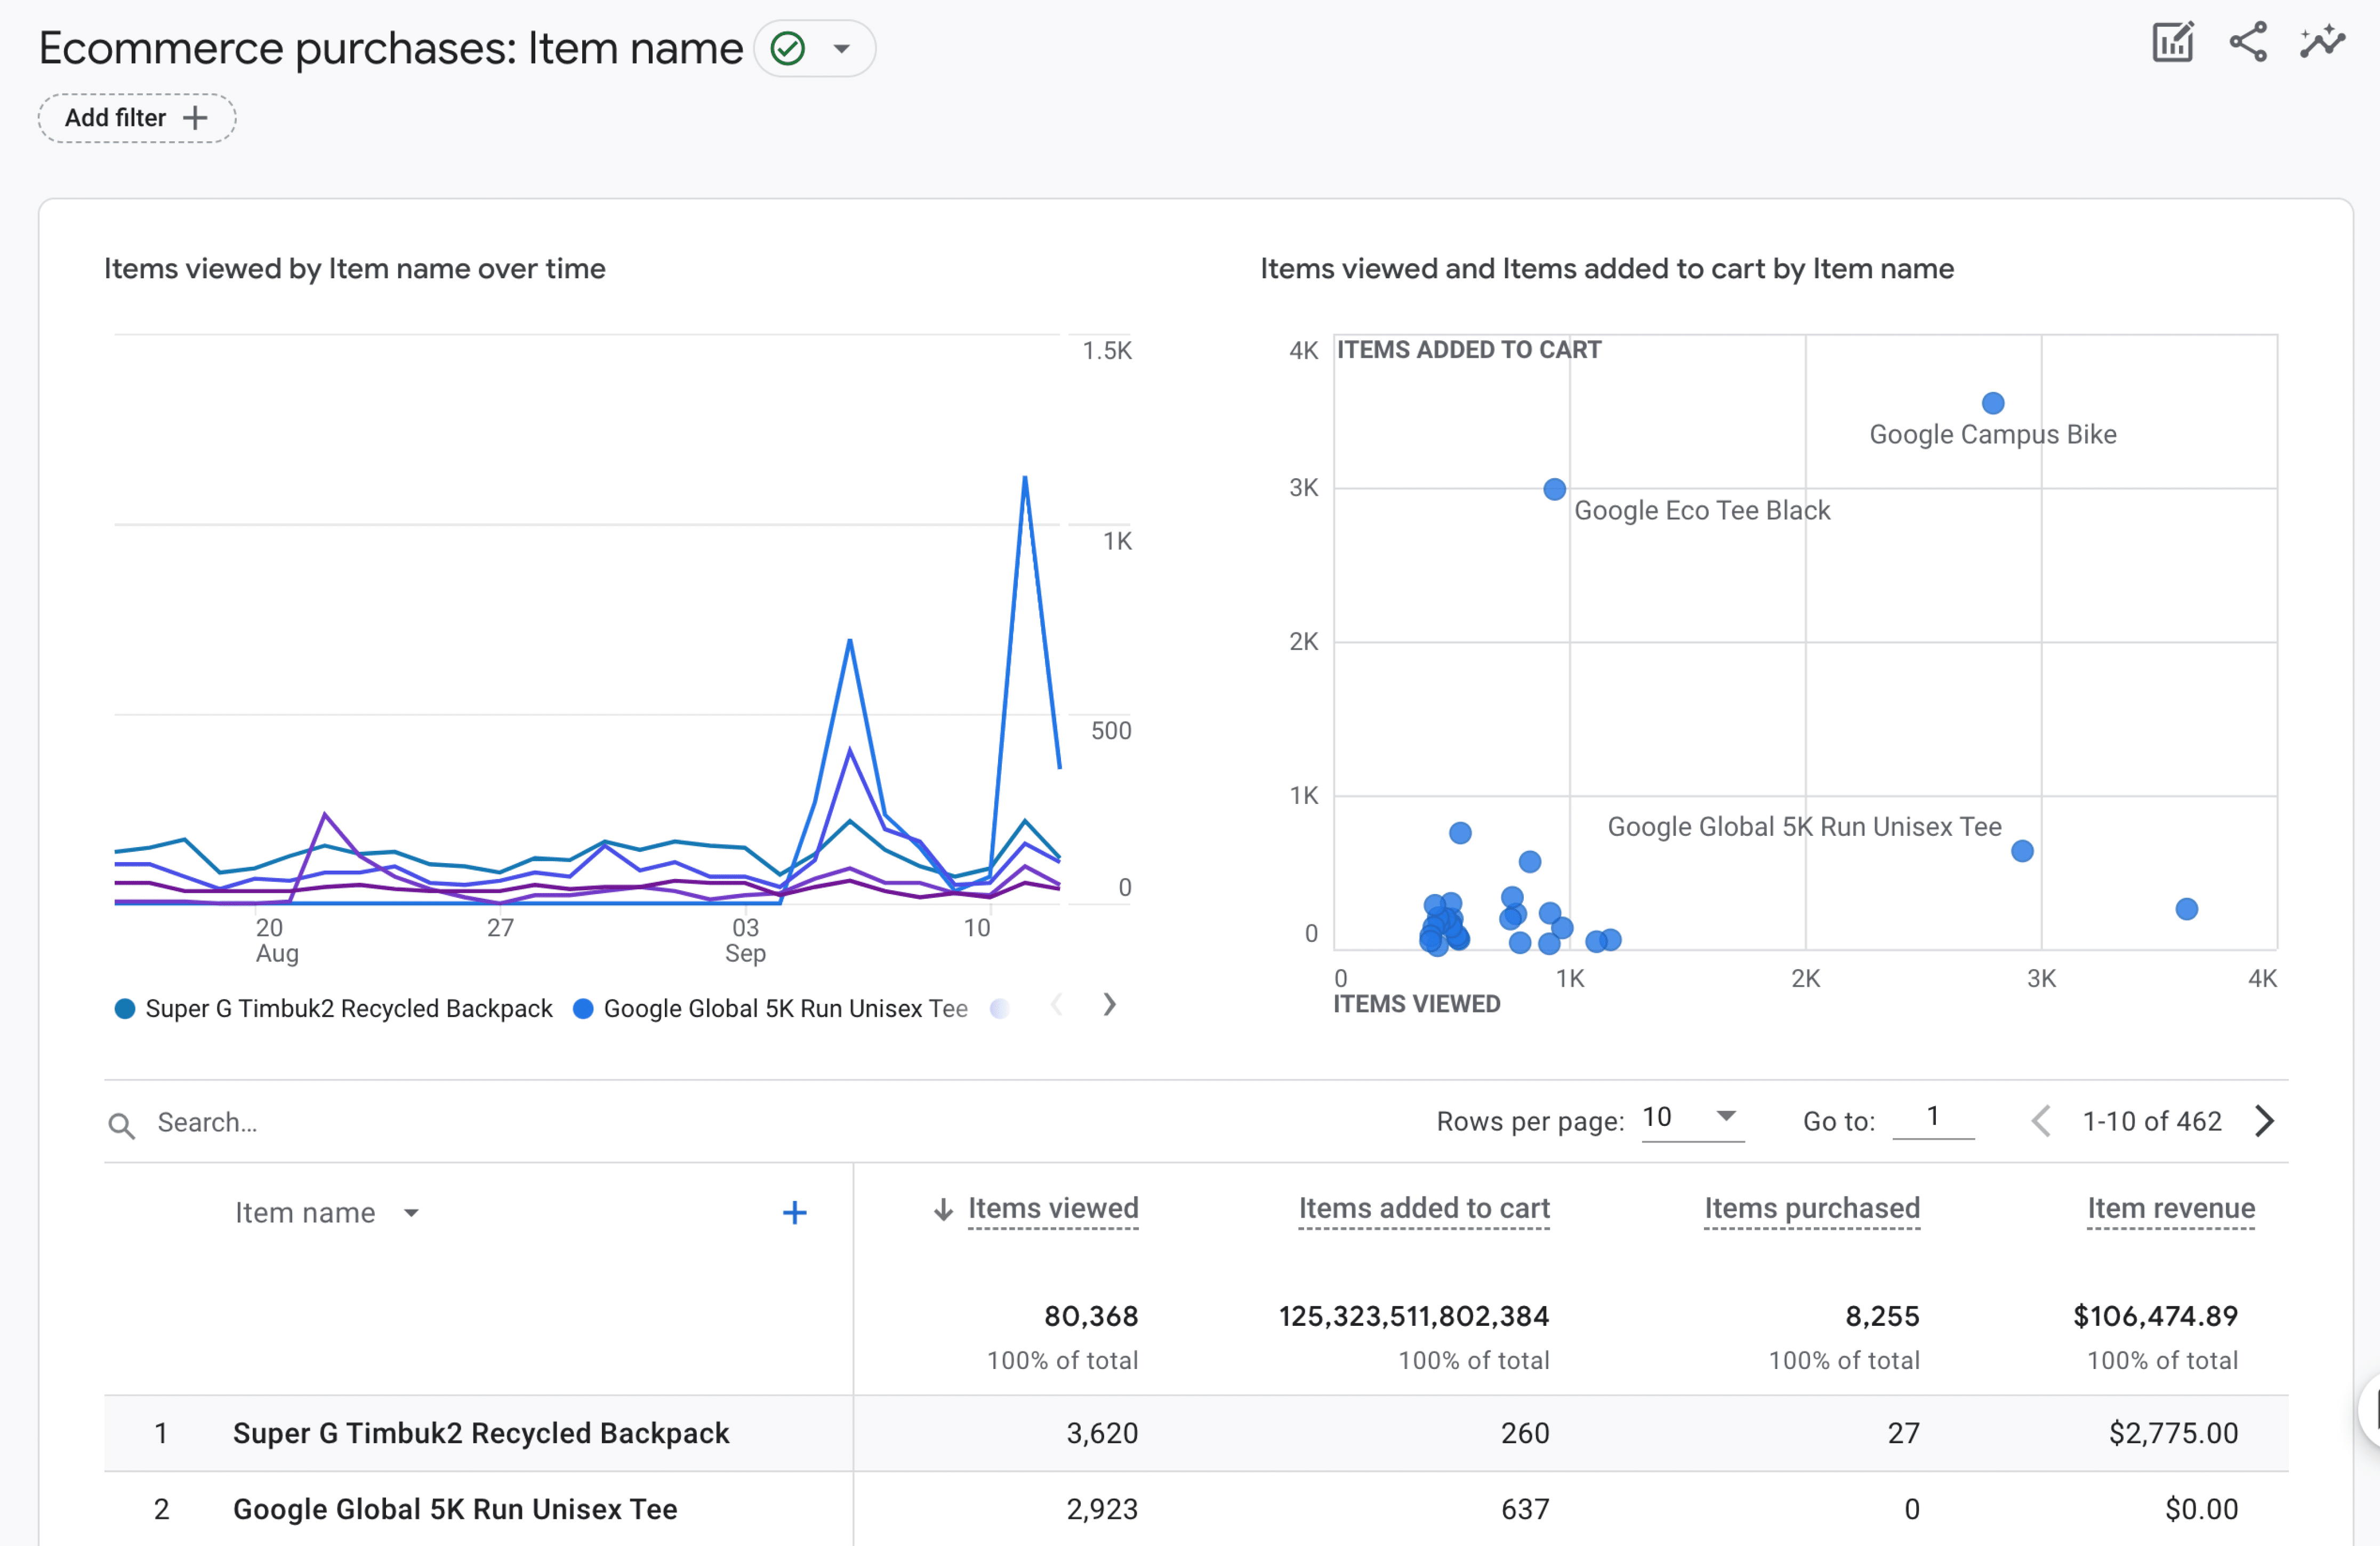
Want to dig deeper into product performance? The Ecommerce Purchases report shows you product-level details like how many times people viewed each product and how much revenue each one generated.
Purchase Journey
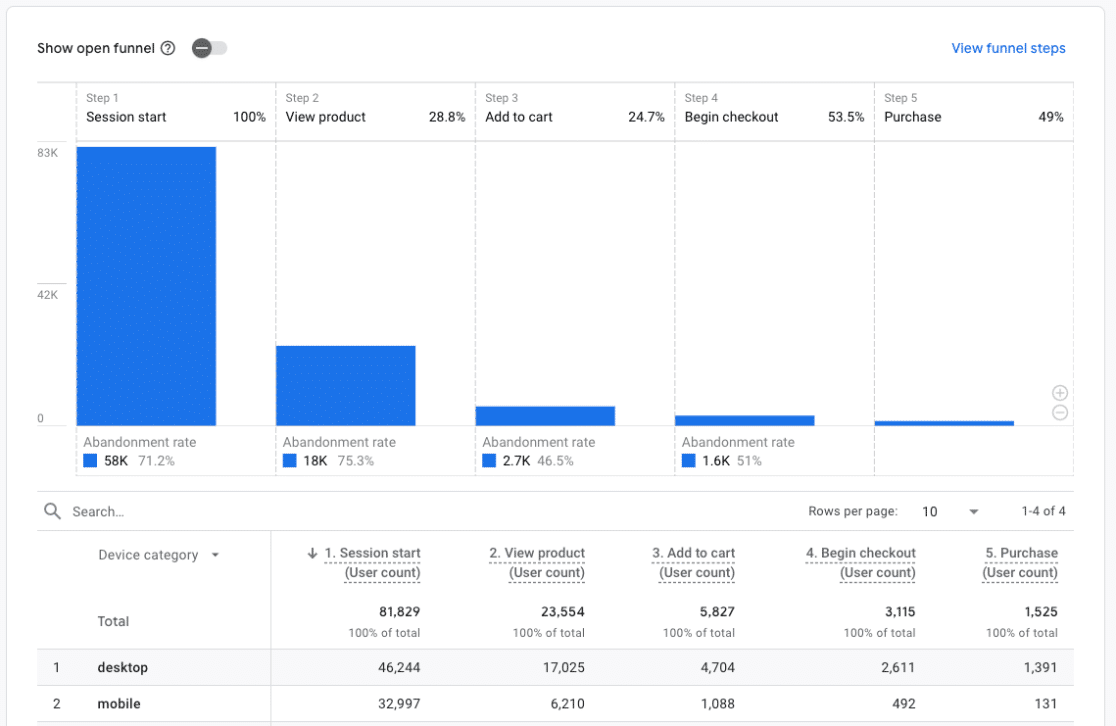
The Purchase Journey report is fascinating because it shows you the details about how users travel through your website. See how many people continue their journey from landing page to product page to add to cart to checkout to purchase. This report defaults to showing these metrics by device category, but you can change it to country, region, city, and other demographics.
Checkout Journey
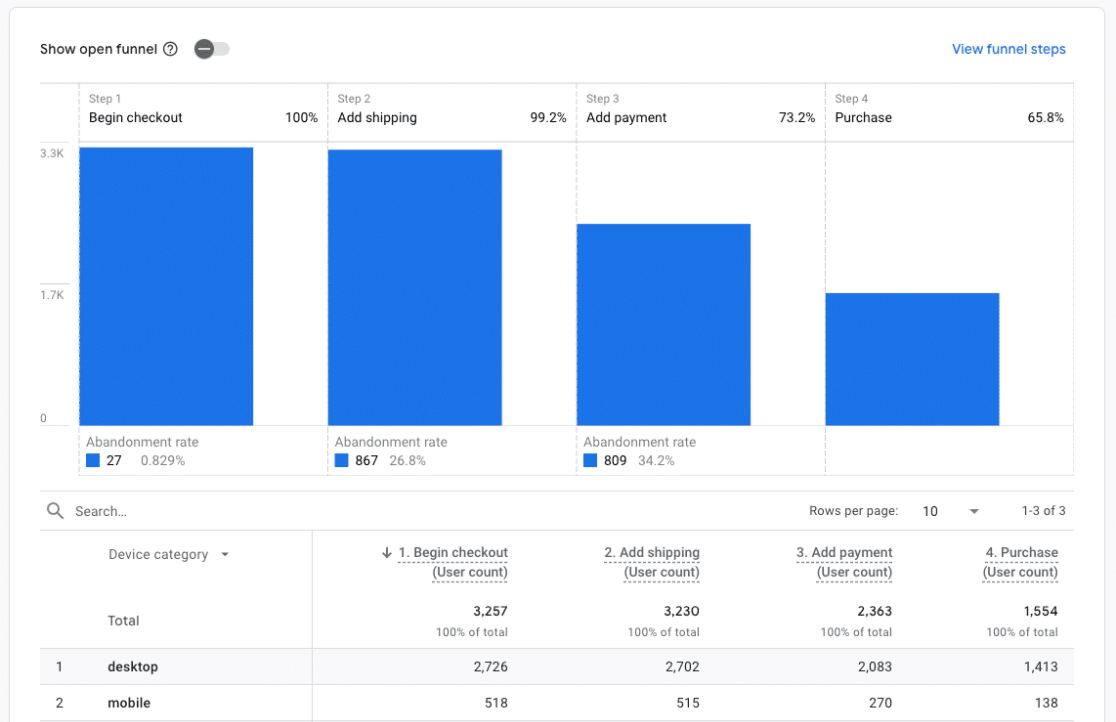
For optimizing your checkout process, the Checkout Journey report is invaluable. It shows you exactly where people might be dropping off during checkout, which is super helpful for fixing any friction points in your sales funnel.
Promotions
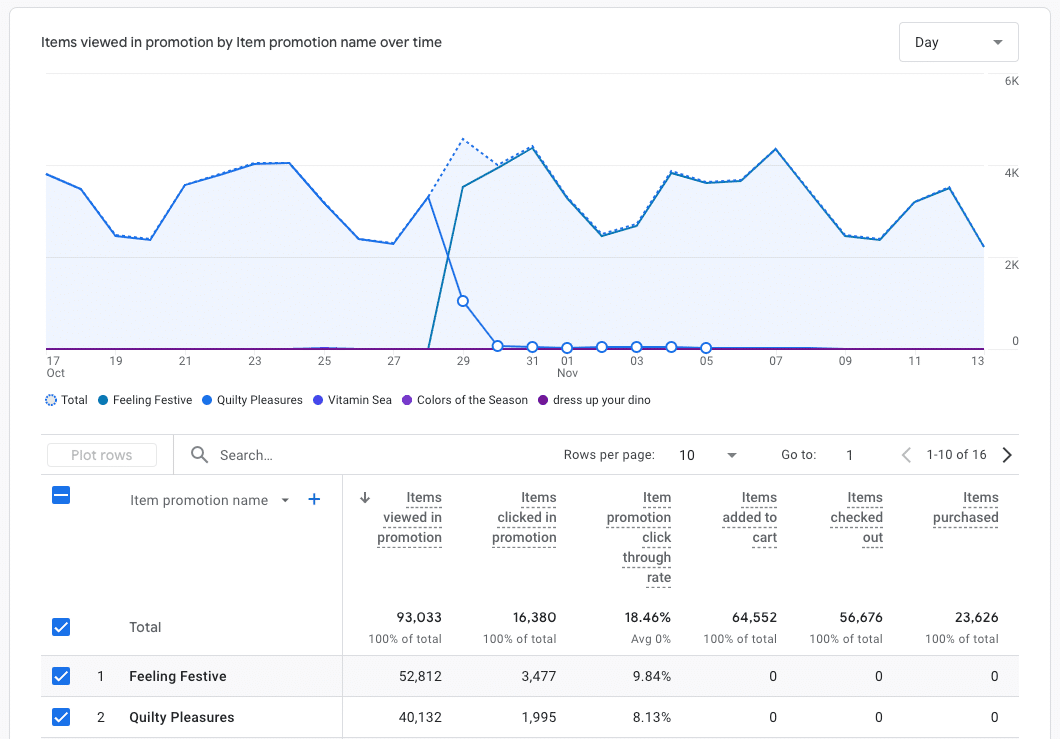
The Promotions report is perfect for tracking how well your internal marketing efforts are working. Running a banner ad or special offer? This report will tell you if it’s actually catching people’s attention and driving sales. Use the report to tweak your promotions as needed.
Transactions
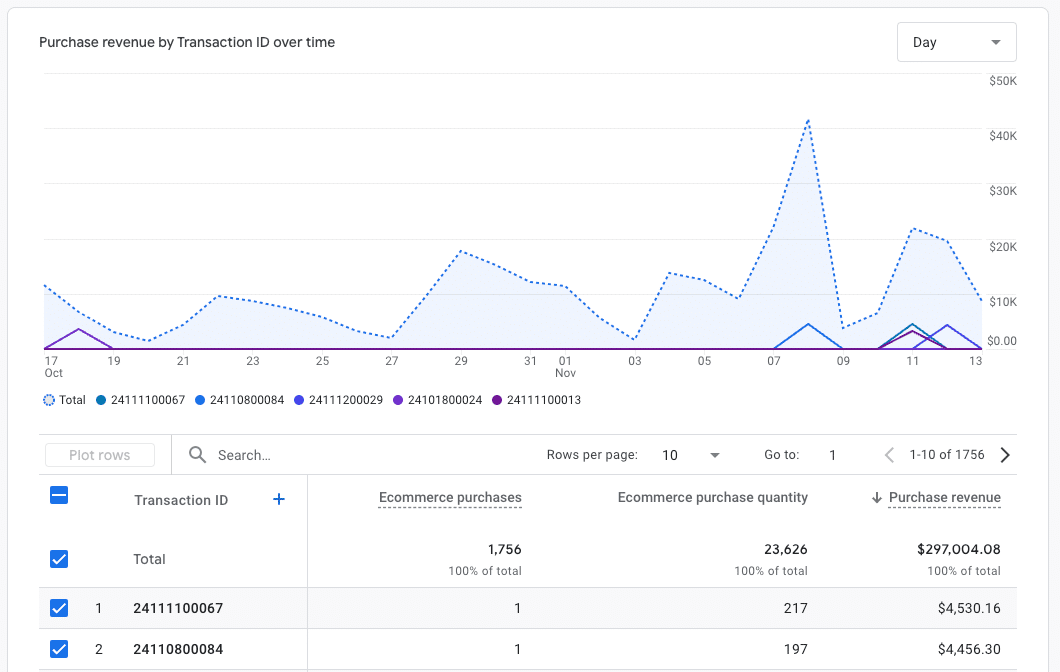
Finally in the Monetization section is the Transactions report, which gives you a detailed look at individual purchases. It’s like your digital receipt book! Use it to track individual order data.
Next, let’s talk about keeping your visitors coming back with the Retention report:
Retention
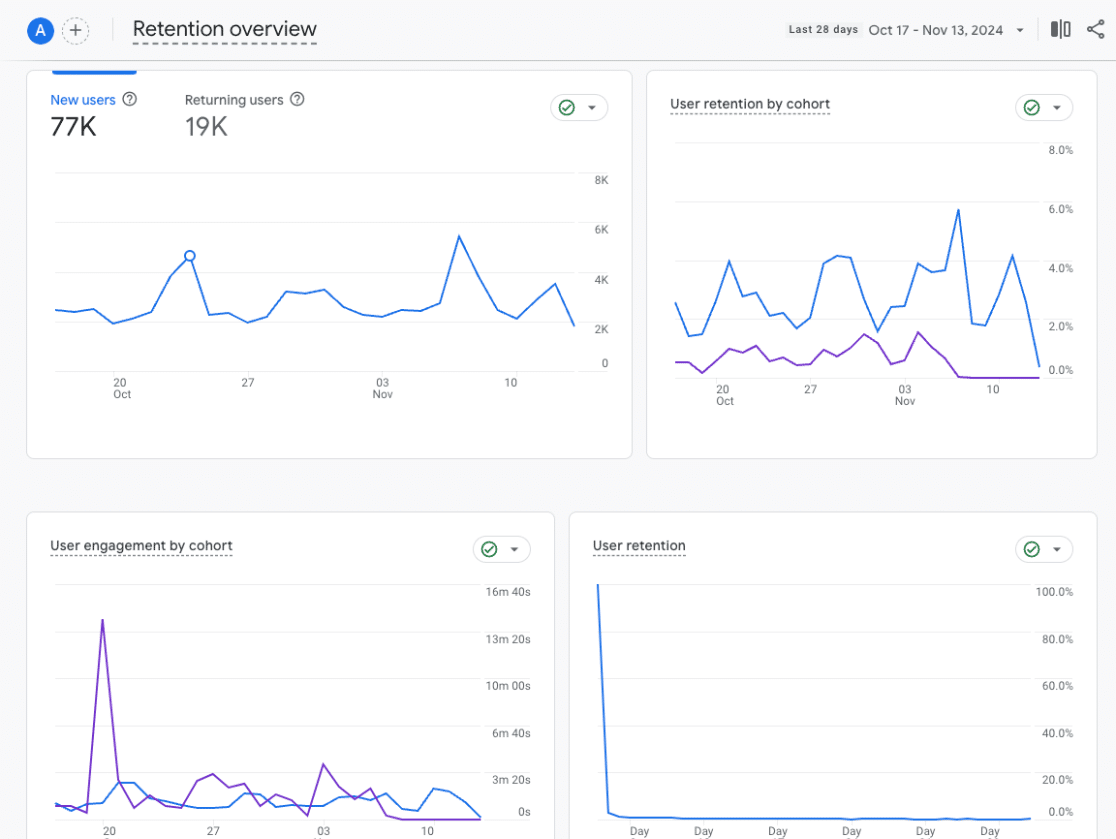
The Retention report is one of my favorites because it tells you how well you keep people interested in your site over time. It’s like a loyalty tracker—are people coming back for more, or are they mostly one-and-done visits? This information is gold for understanding whether your content and user experience are compelling enough to build a loyal audience.
Next up are the User Attributes reports, which help you really understand WHO is visiting your site.
User Attributes Overview
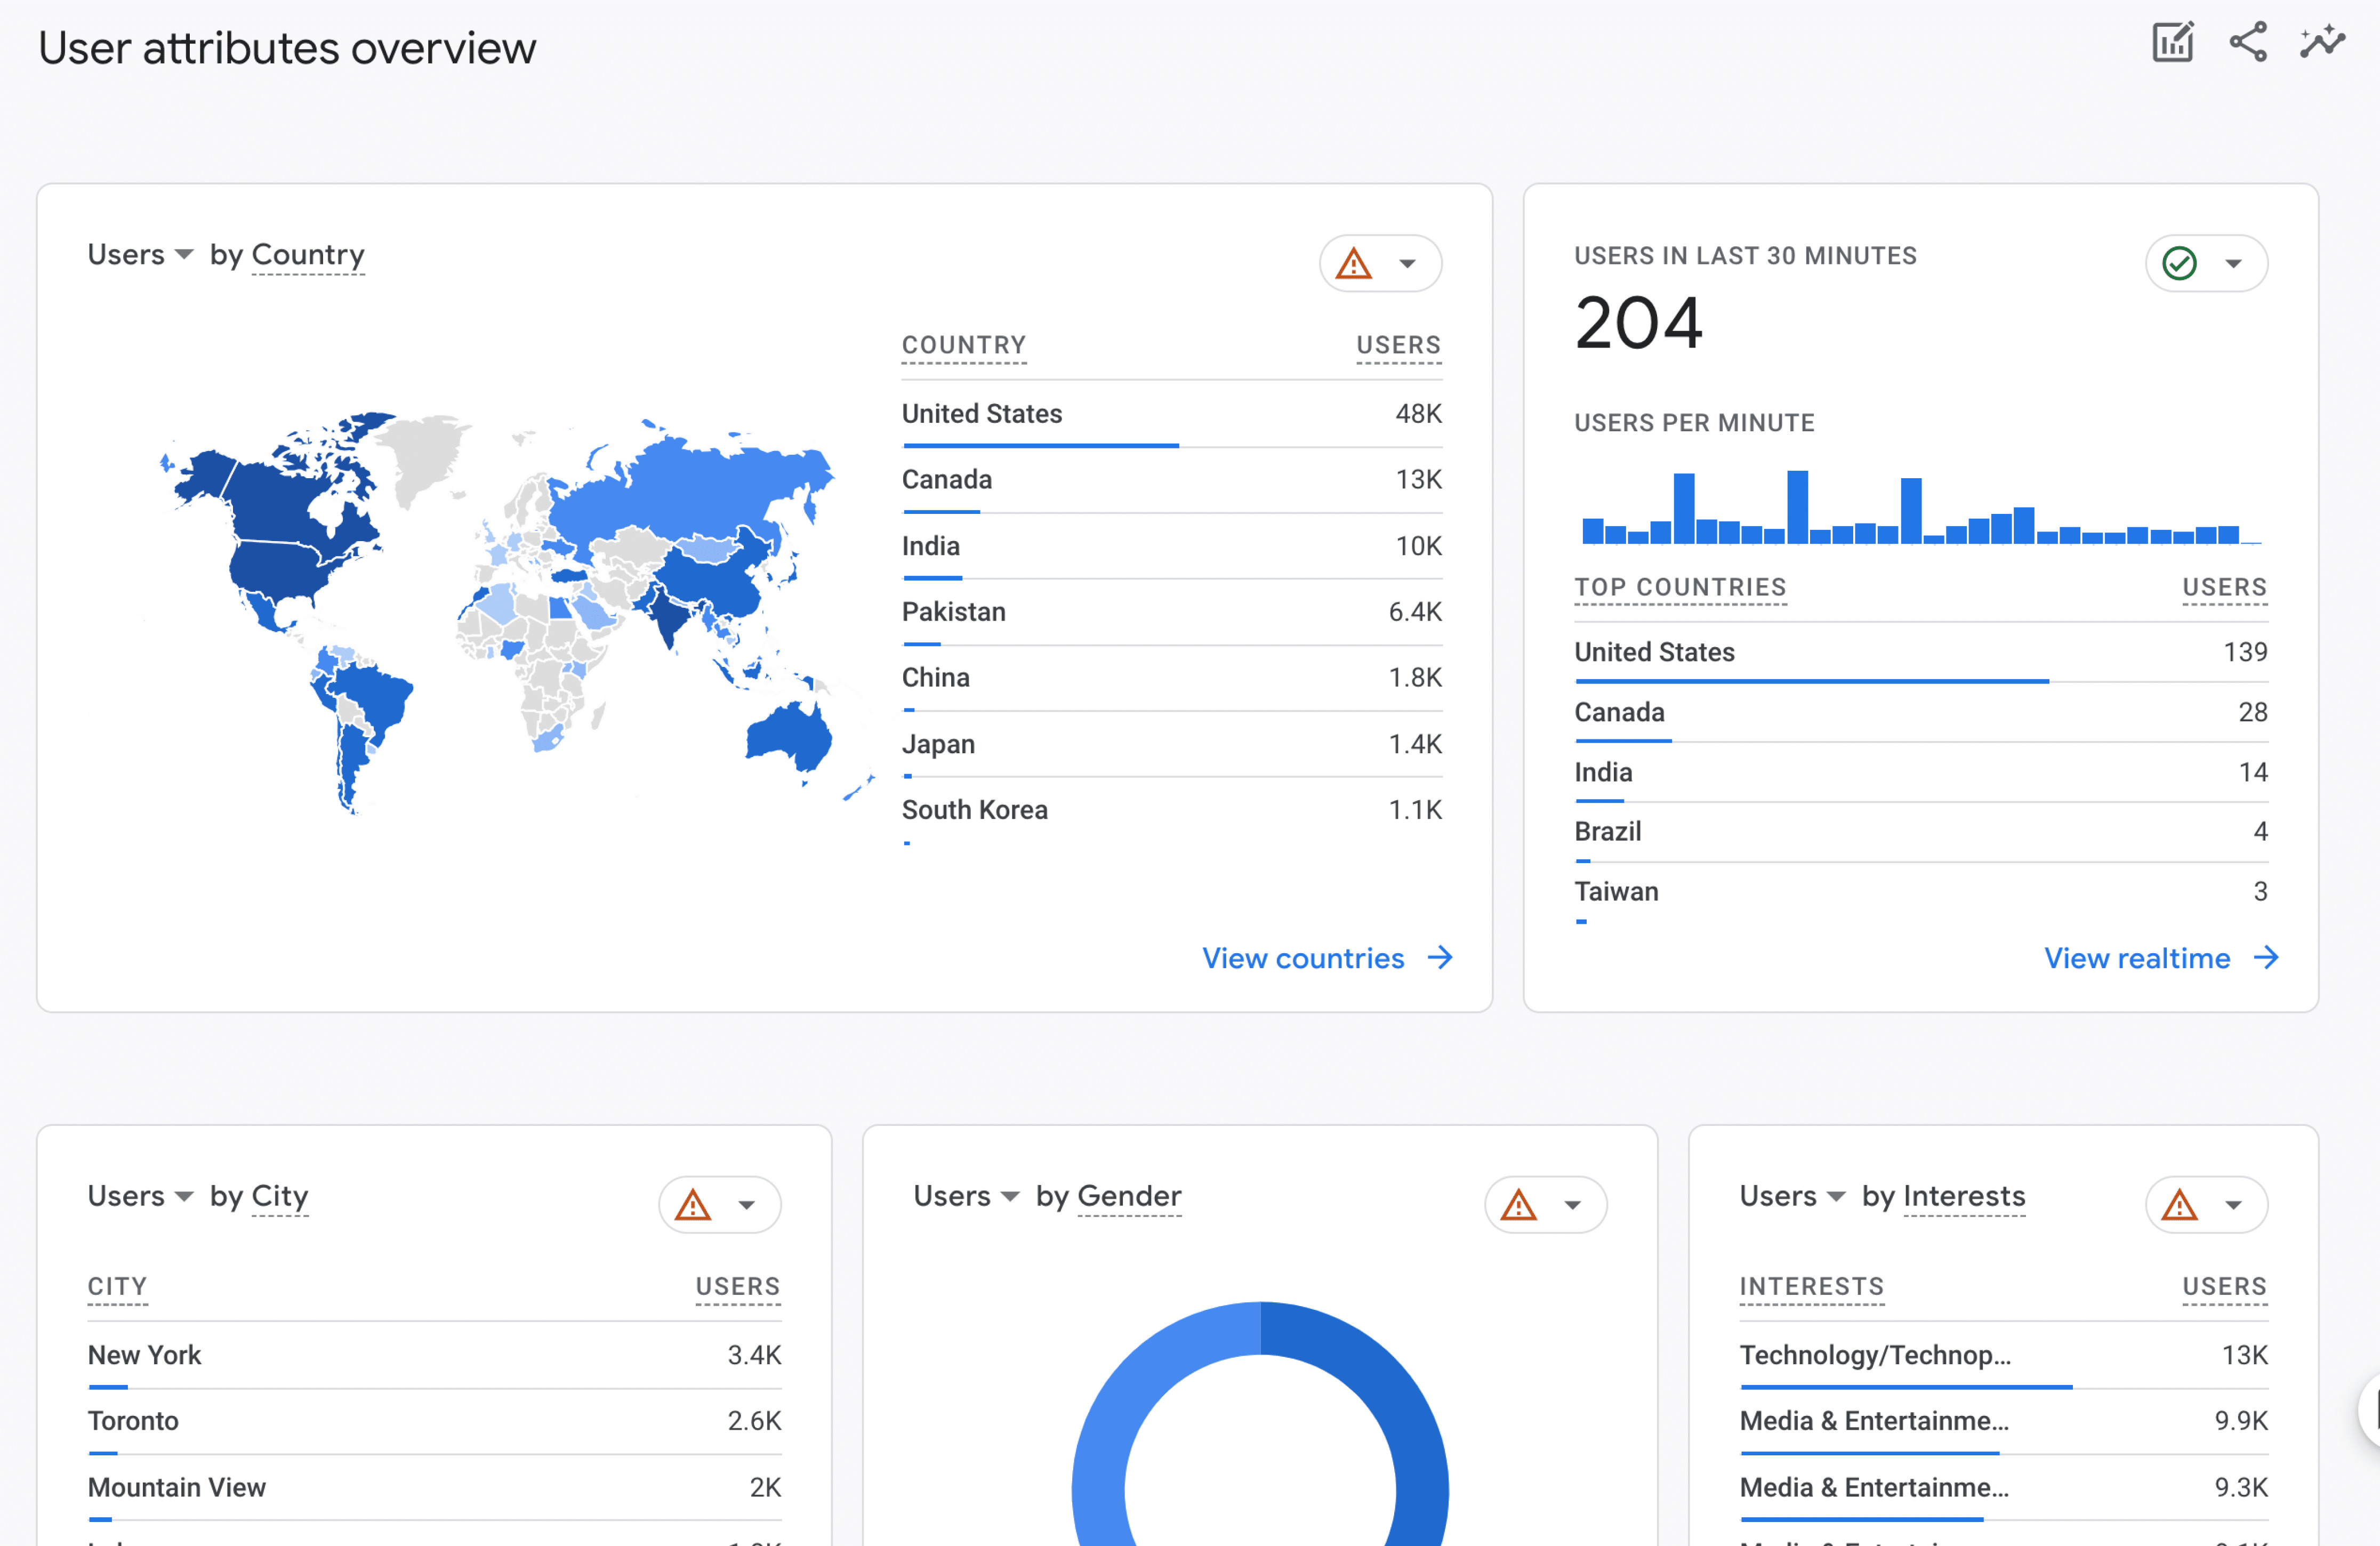
The User Attributes Overview is where you go for getting to know your audience personally. It paints a picture of who your typical visitor is—their interests, what devices they use, and other characteristics that help you create content that really resonates with them. Use this report to make informed audience targeting decisions.
Demographic Details
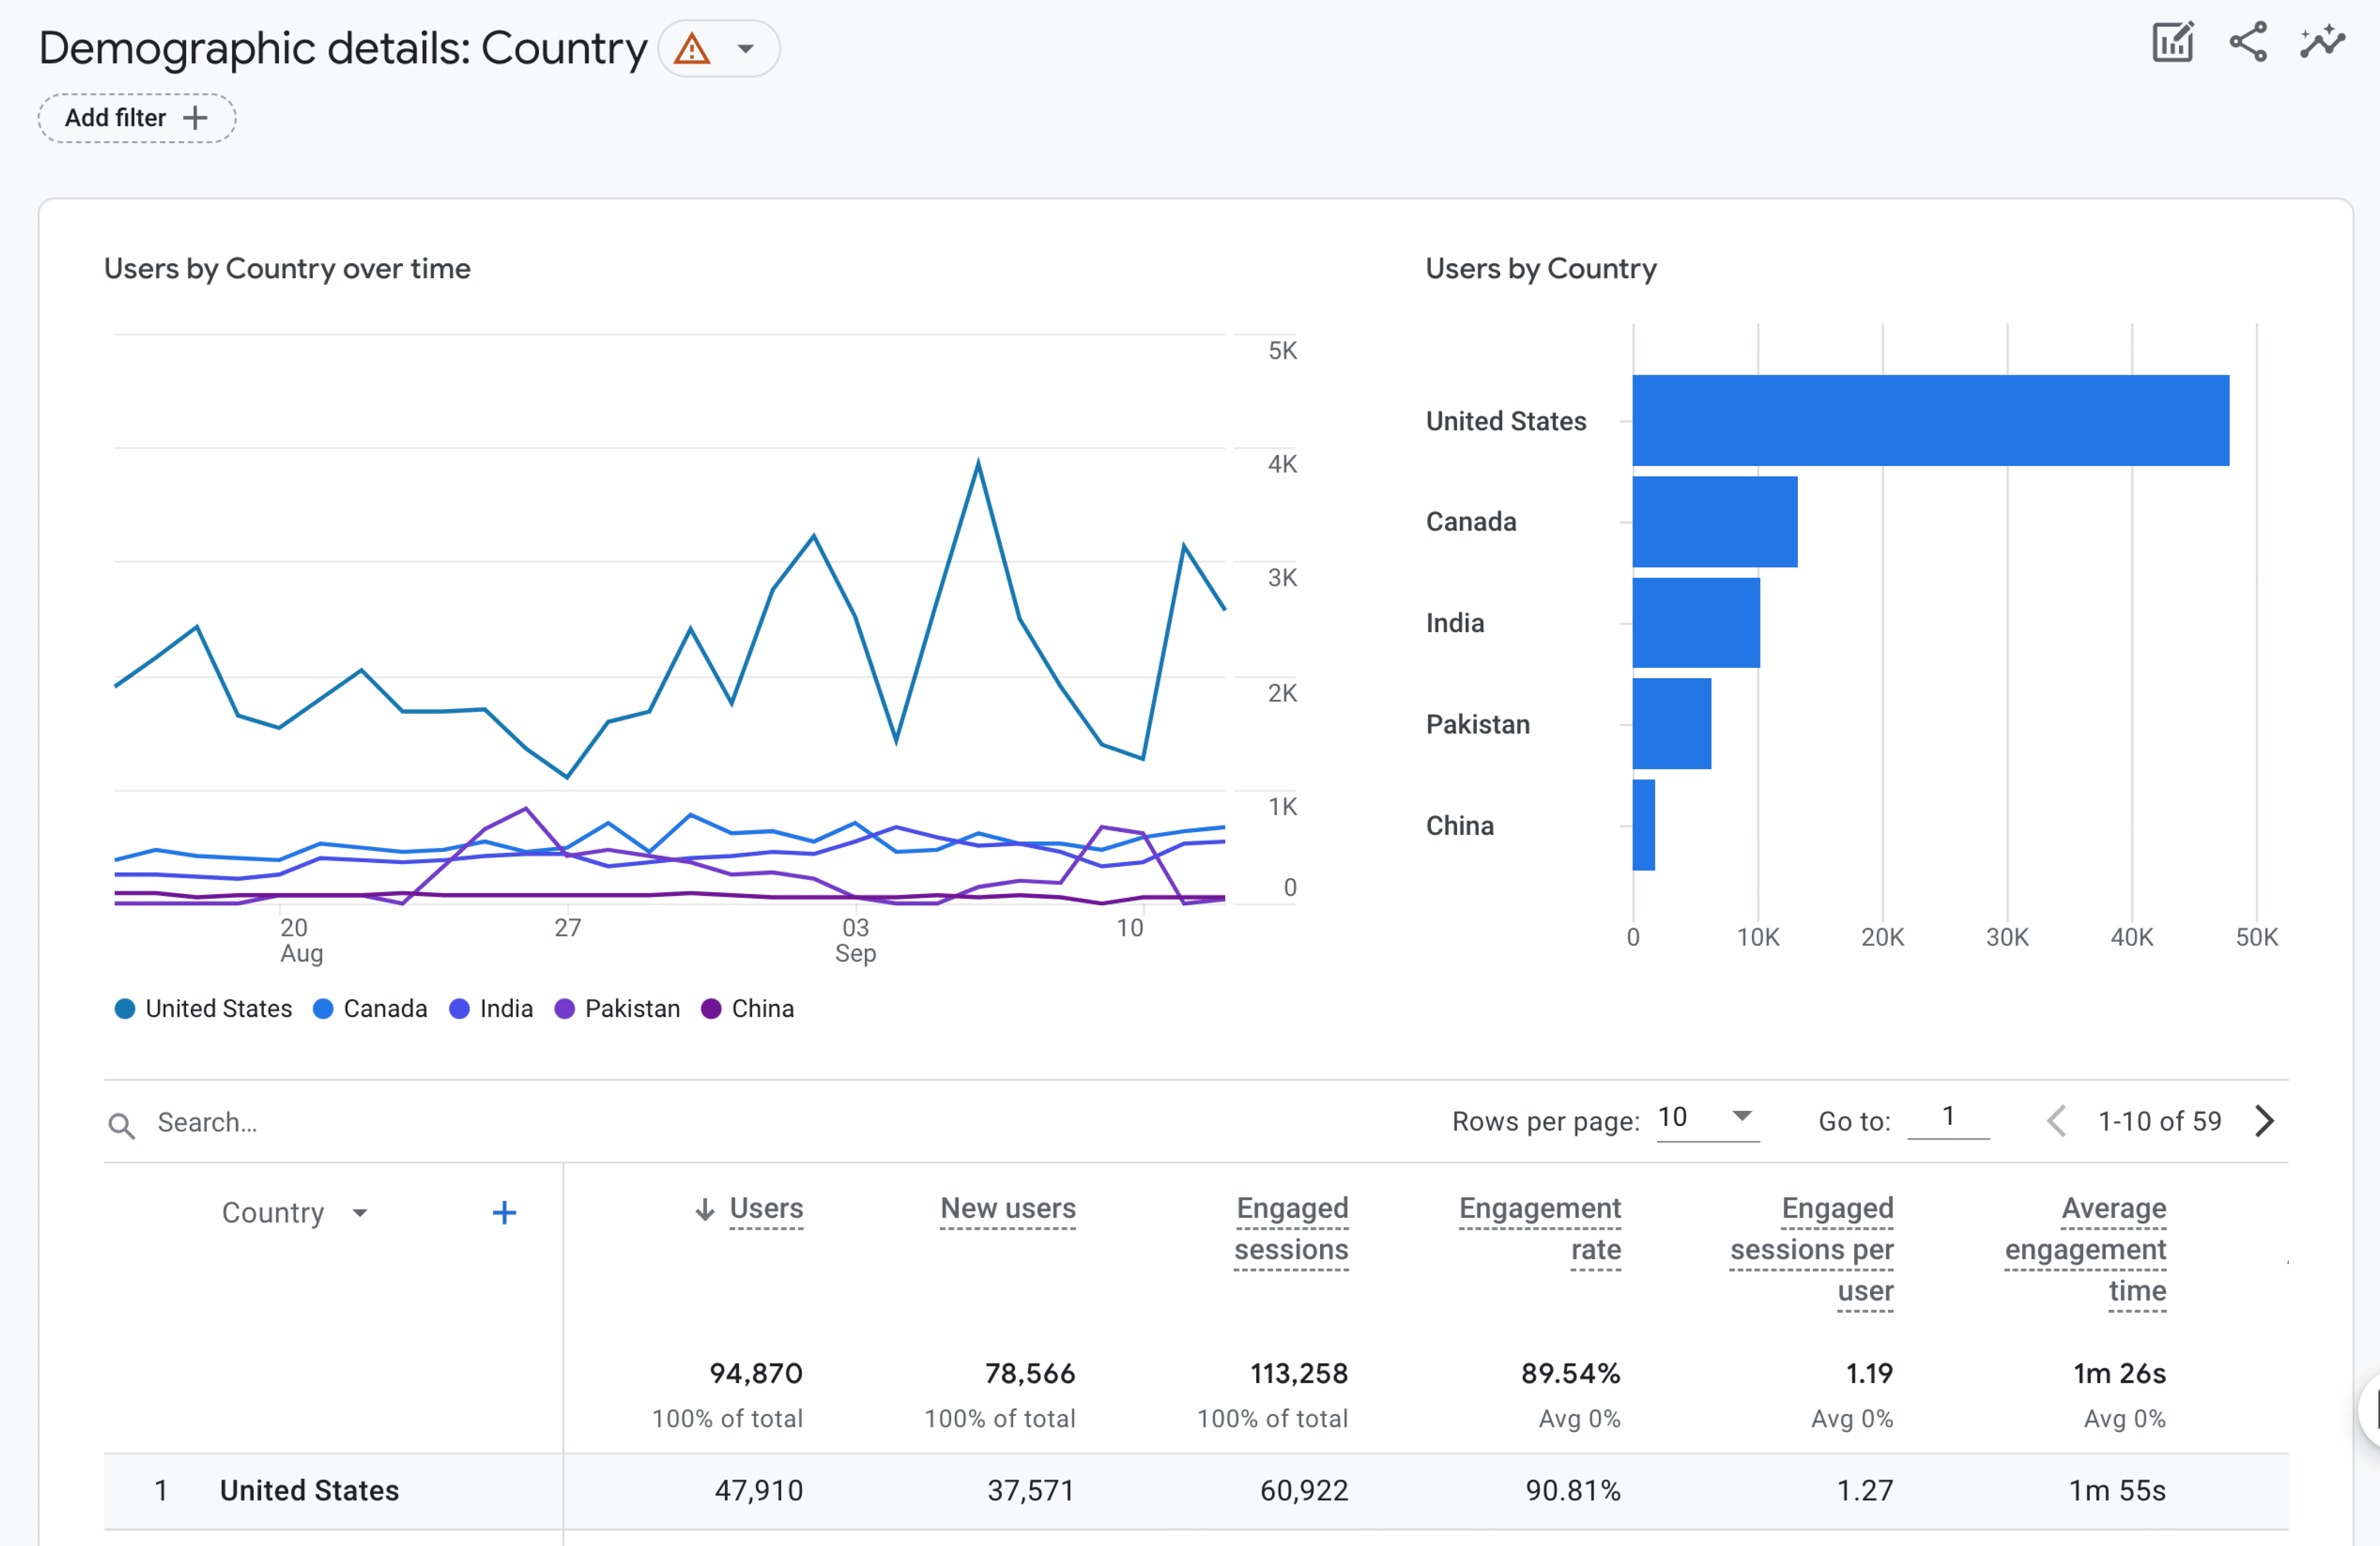
Want to get even more specific? The Demographic Details report breaks down your audience by age, gender, and location. Use demographics to help you tailor content to better serve your actual audience rather than who you think your audience is!
Audiences
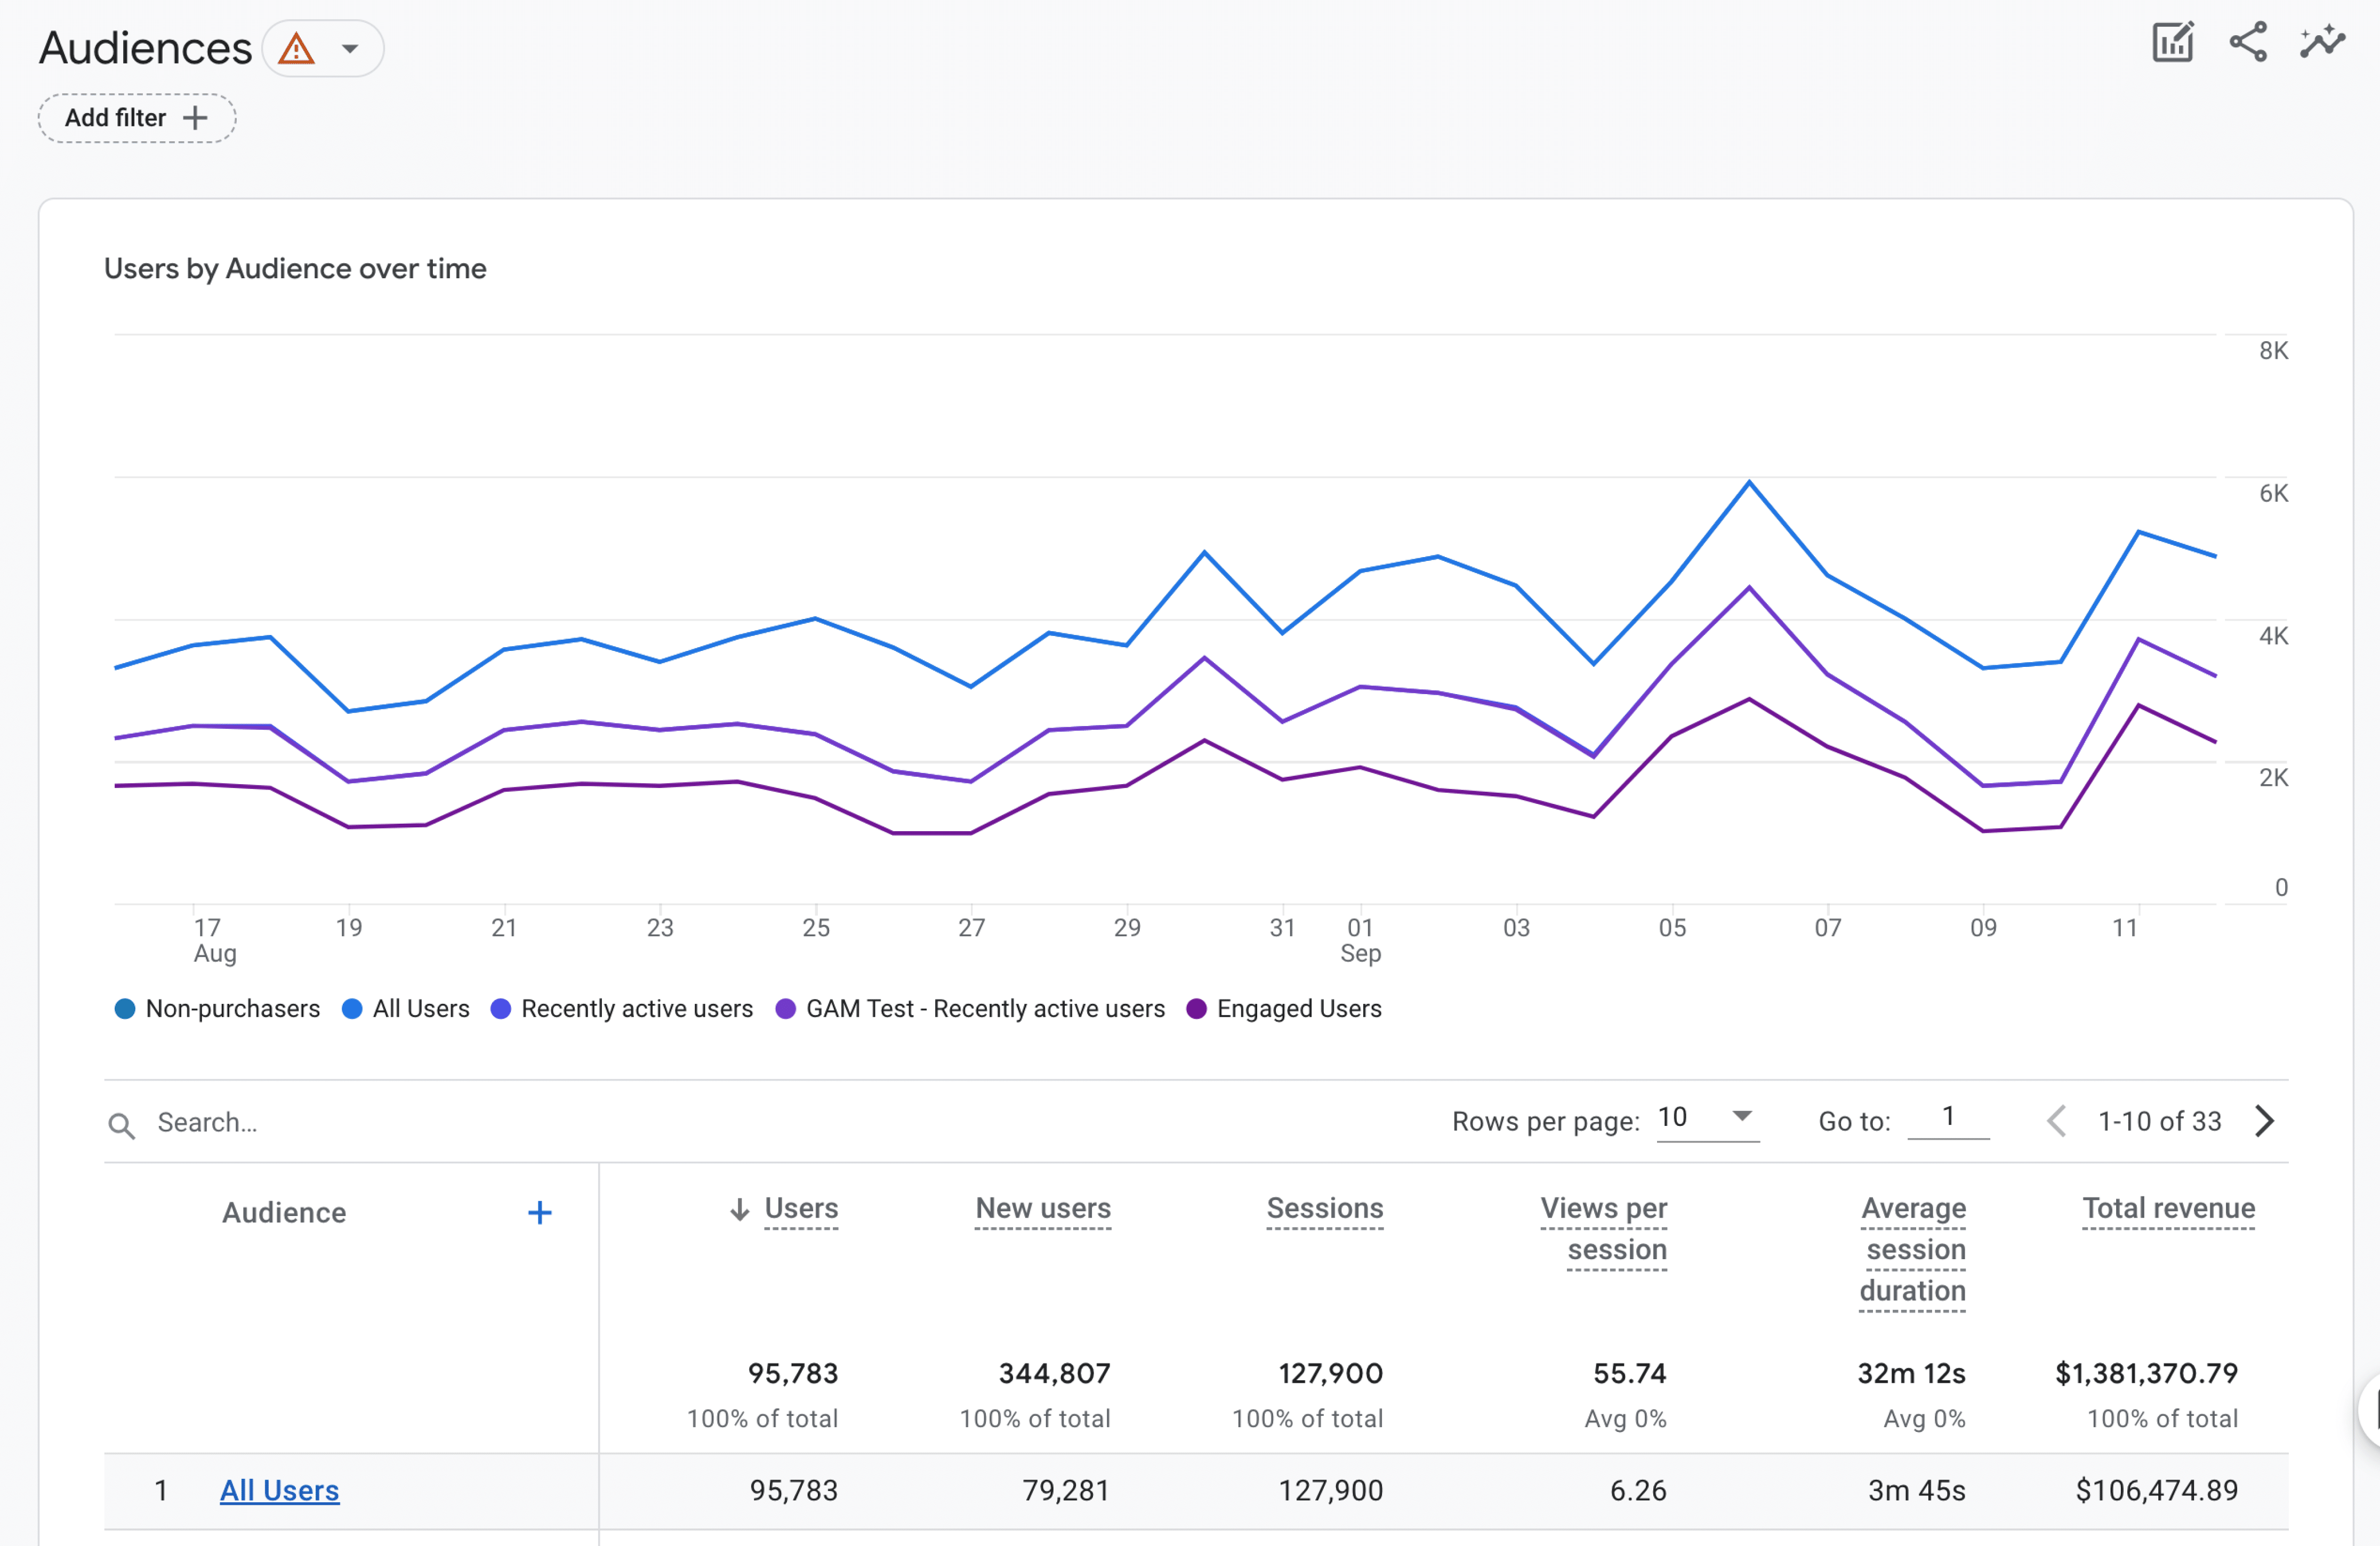
The Audiences report is particularly powerful because it lets you create and track specific groups of users based on their behavior. For example, you might want to track people who’ve spent more than 5 minutes on your site or those who’ve made multiple purchases. This report is really customizable because you create audiences based on conditions that you define yourself.
Finally, let’s geek out a bit with the Tech reports:
Tech Overview
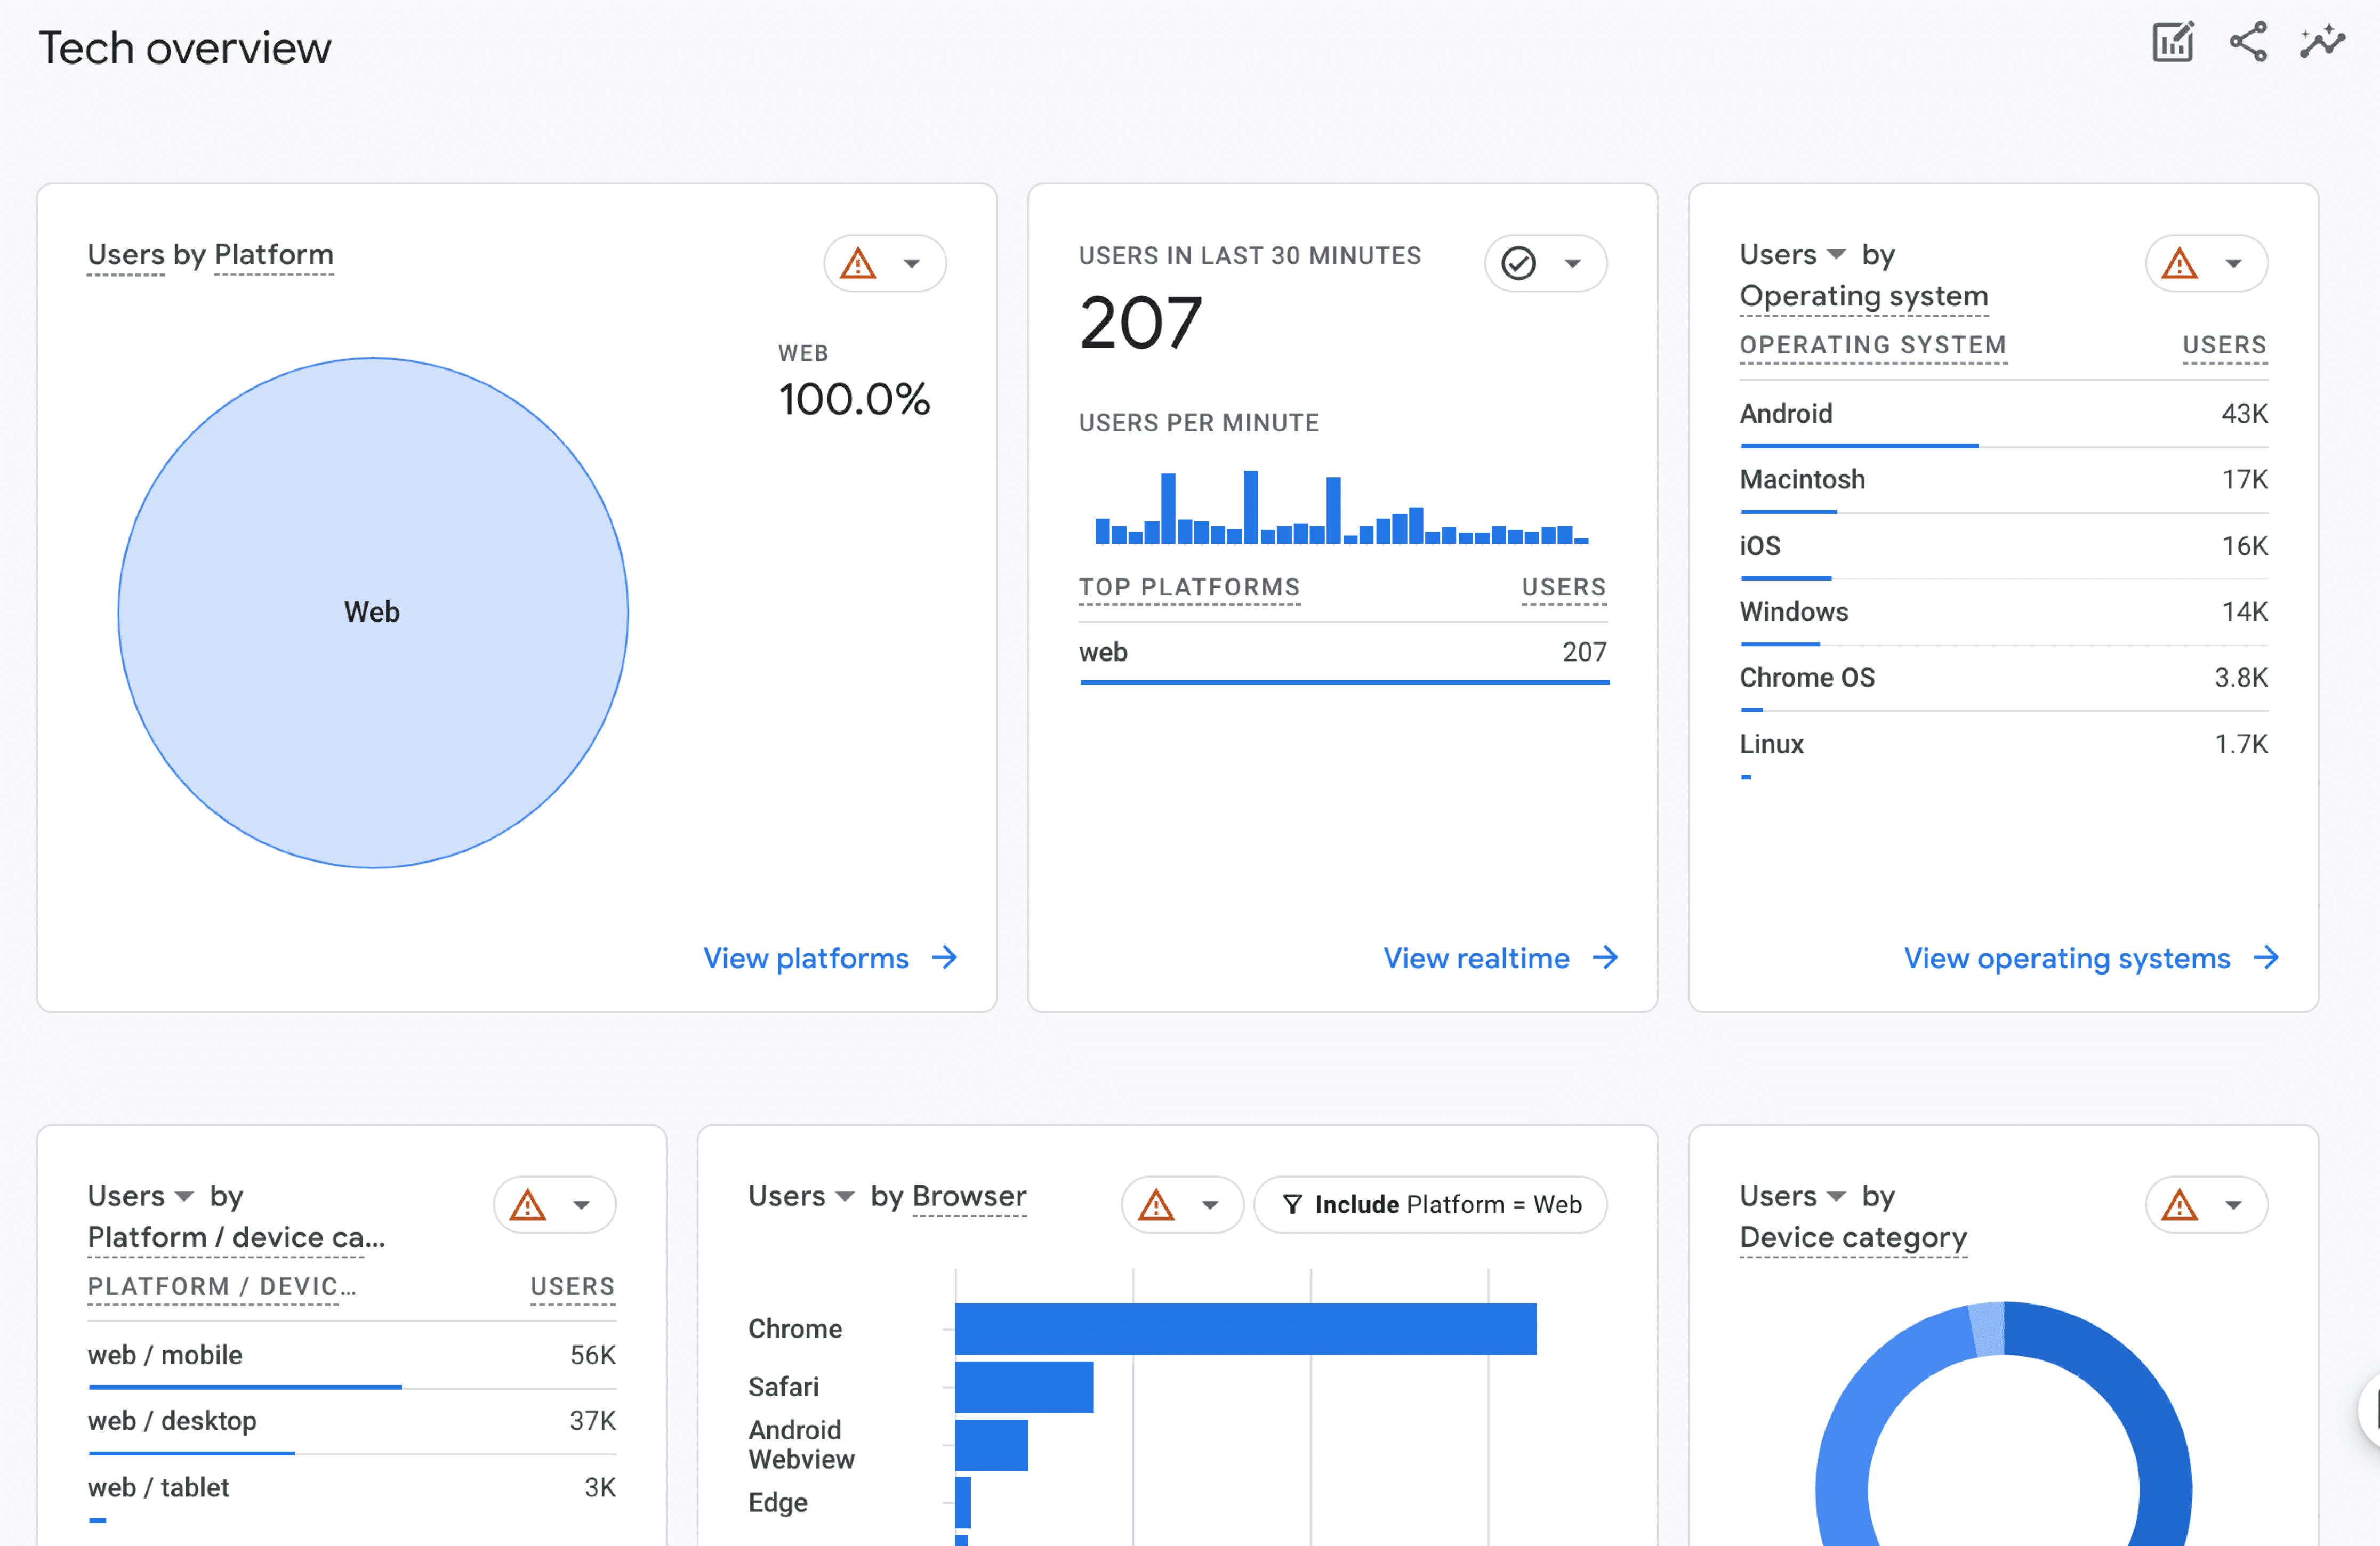
The Tech Overview report shows you what devices and platforms your visitors are using to access your site. Are most of your visitors on mobile? Desktop? This information is crucial for making sure your site works perfectly for everyone.
Tech Details
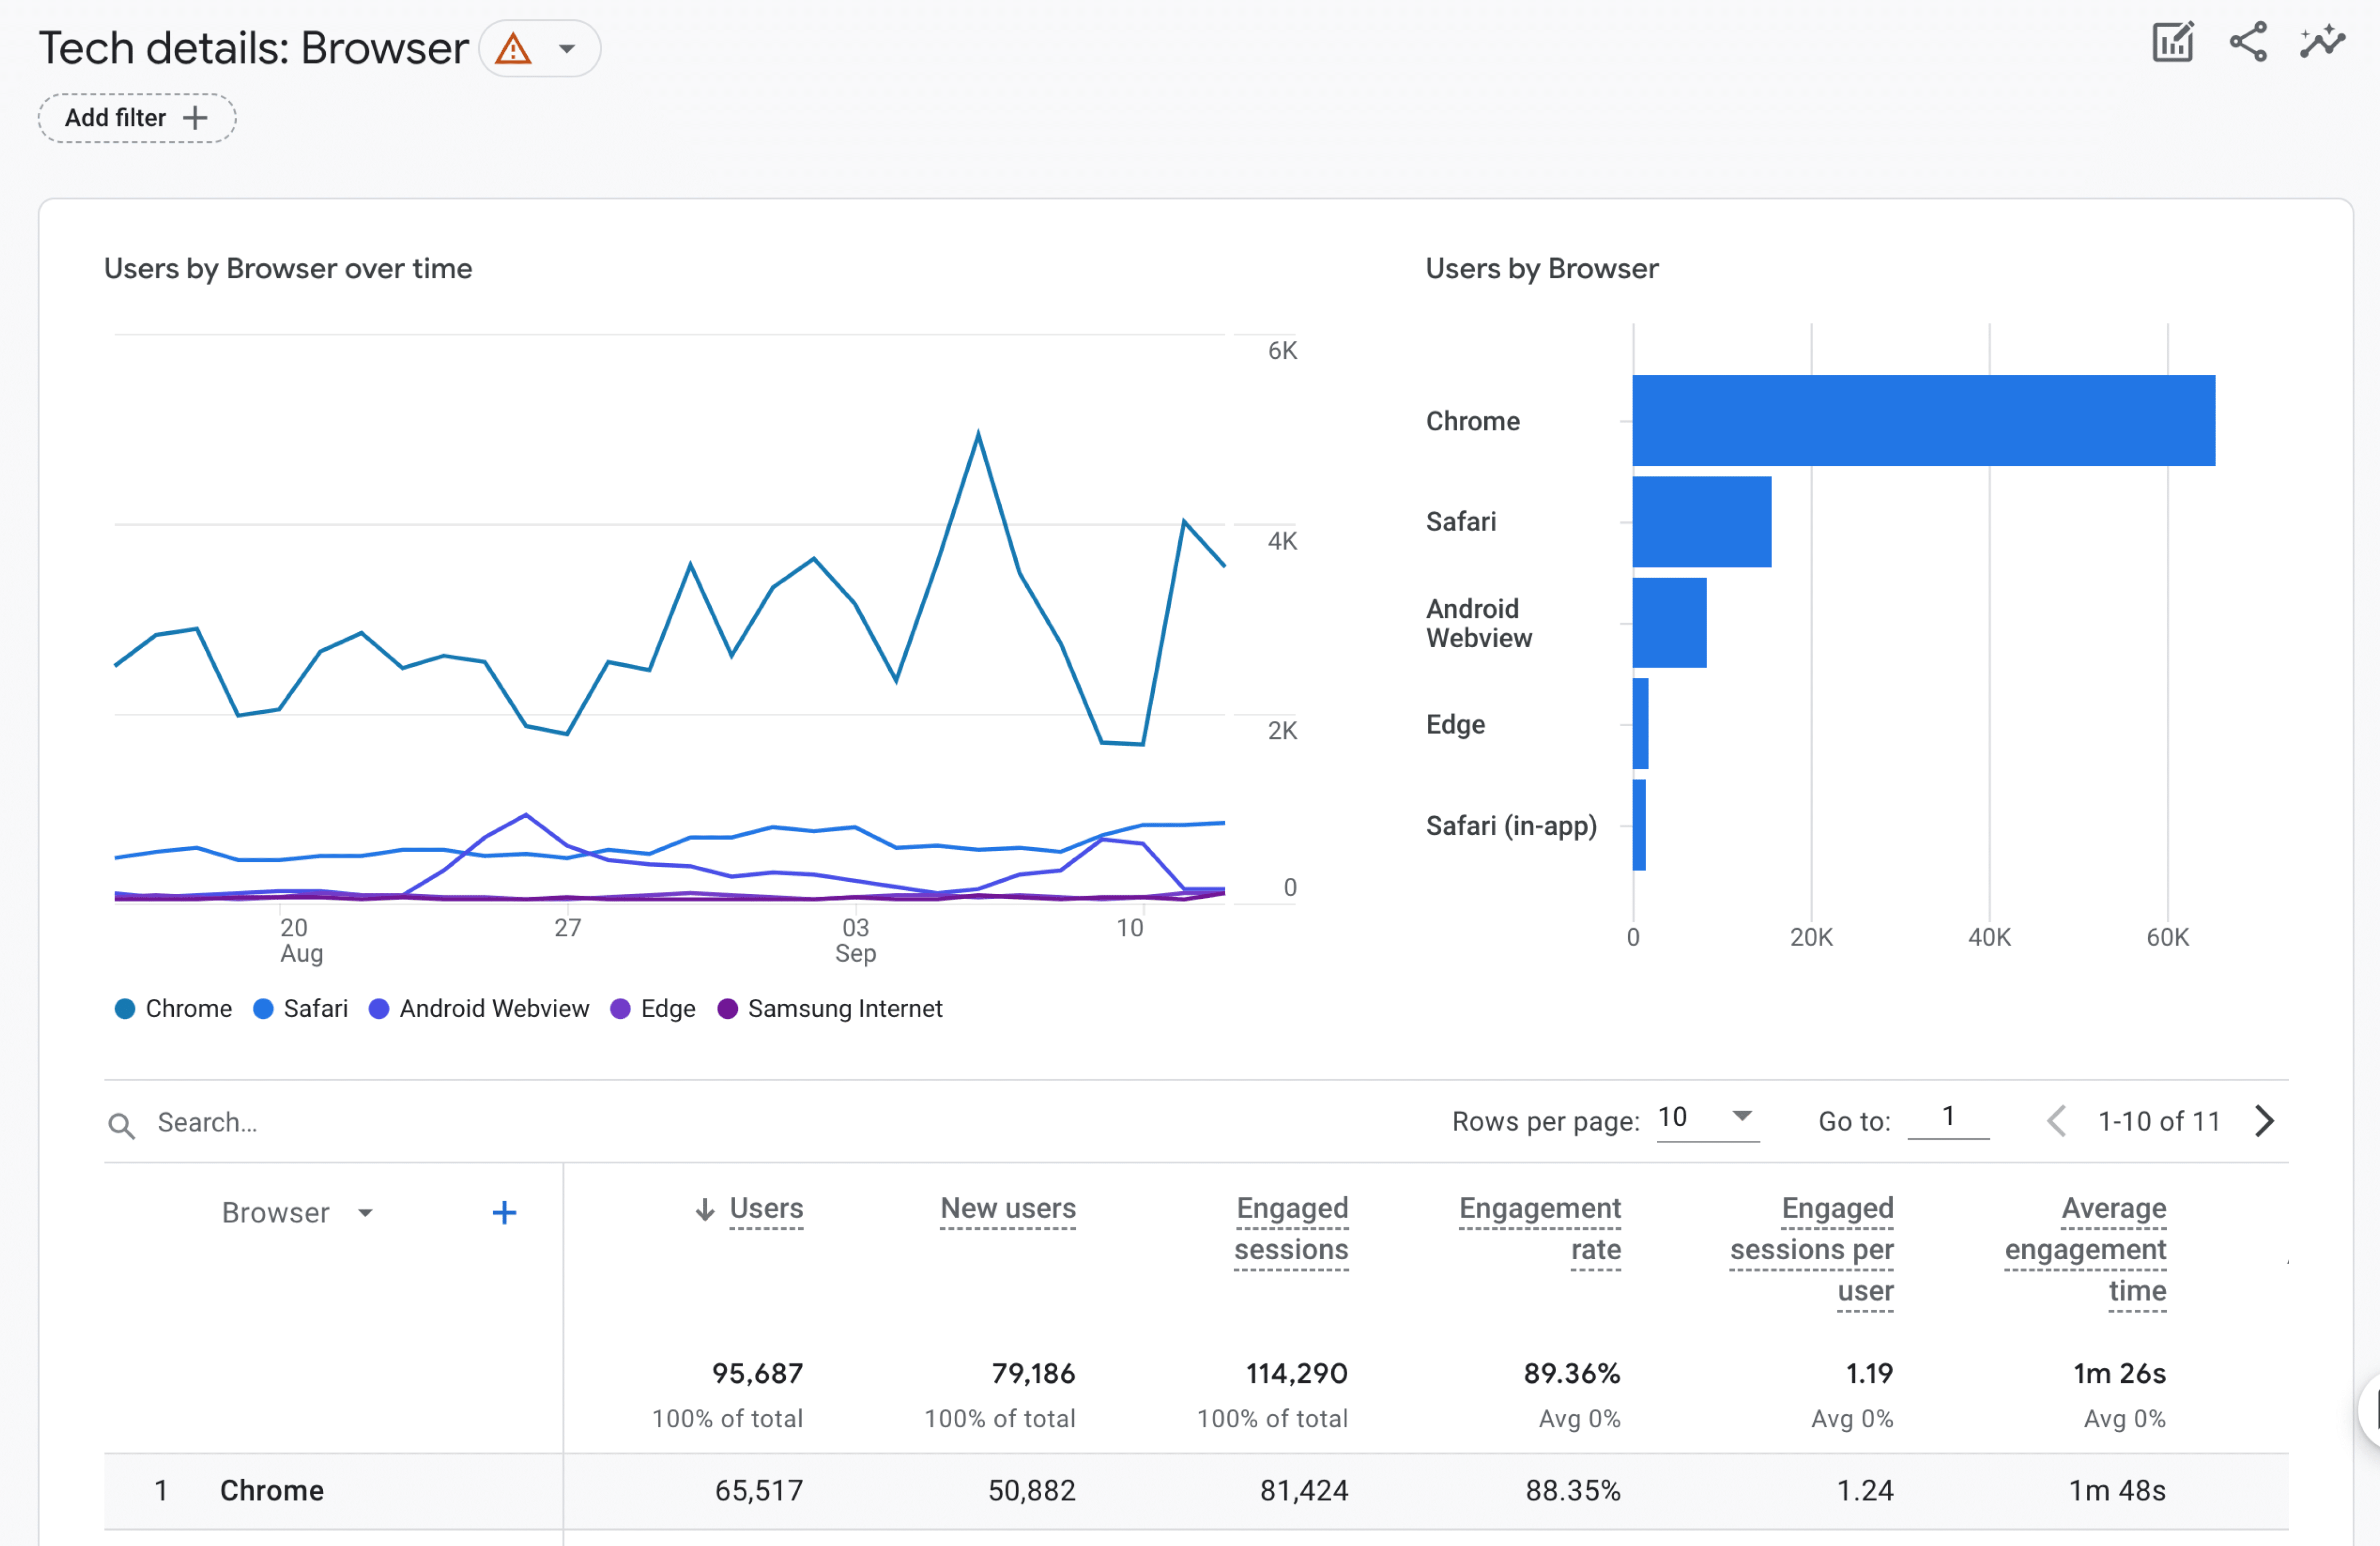
The Tech Details report goes even deeper into the technical aspects of your visitors. It shows user metrics based on specific device models and screen resolutions. This kind of information is super helpful when you’re trying to decide things like what image sizes to use or how to optimize your mobile experience.
That’s all the standard reports!
Make Google Analytics Reports Work for YOU: Customization Tips
Let me show you how to customize GA4’s standard reports so they really work for your specific needs. After all, every business is unique, and your analytics should reflect that! I’m going to share some of my favorite ways to customize your reports so you can zero in on exactly what matters most to your business.
1. Adding Dimensions
Think of dimensions and metrics as the building blocks of your reports. Here’s an easy way to understand them:
- Dimensions are the “what” – things like which cities your visitors are from or which channels they used to find your site
- Metrics are the “how many” – like how many people visited your site or how many conversions you got
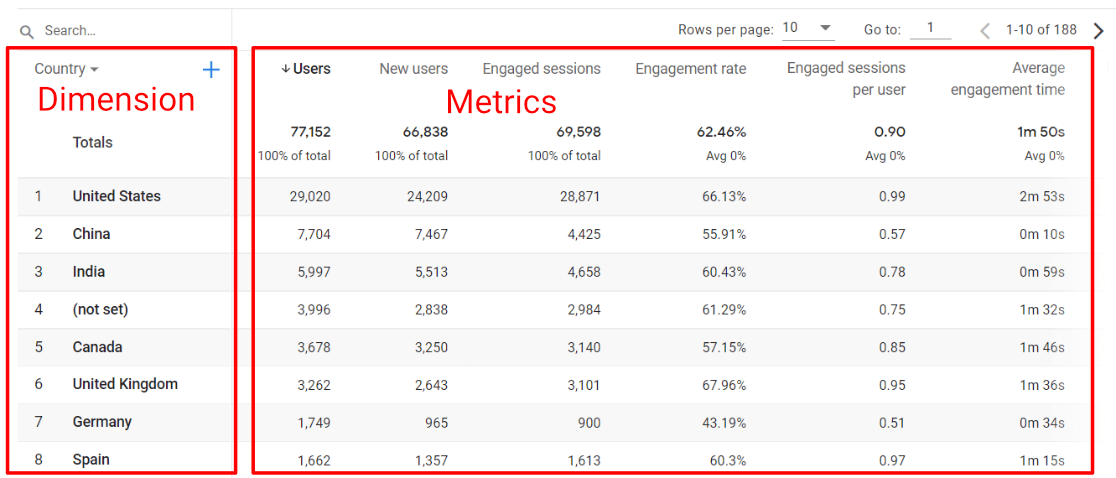
The beauty of GA4 is that you can mix and match these to create exactly the view you need. To start, you can add a dimension to a standard report to get a deeper look at your data.
For example, let’s say you want to know which blog posts are bringing in the most organic traffic from search engines and how each of those posts is performing in terms of user engagement and conversions.
We can see this data in standard reports! Just head to the Traffic Acquisition report. There, you’ll see your organic search traffic all lumped together:
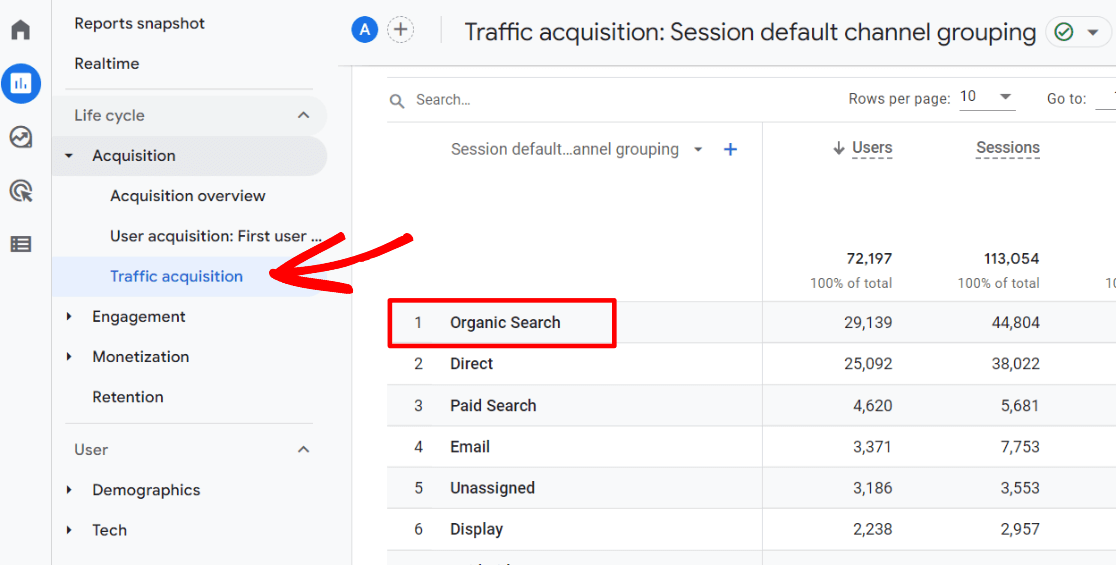
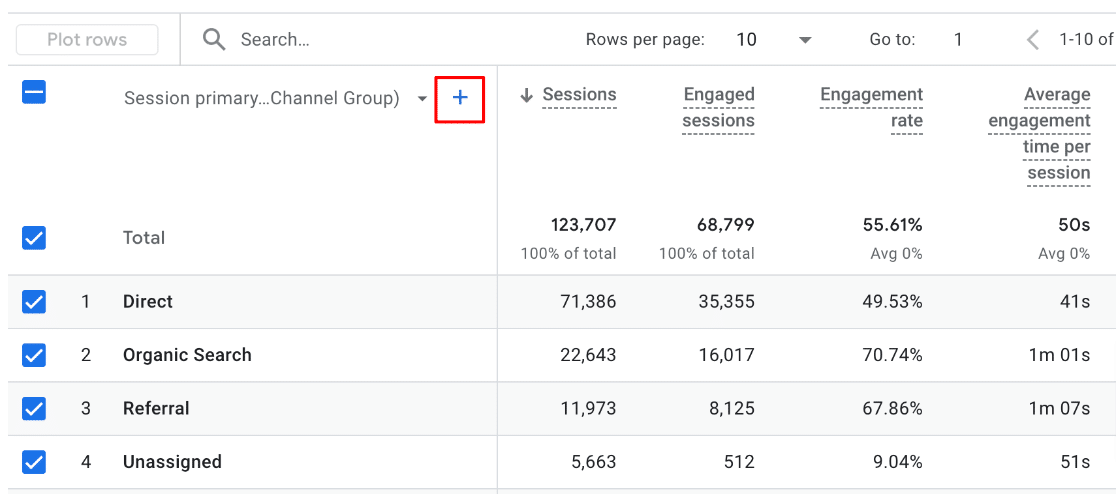
Now, click the blue plus sign above the dimension column:
Then, go to Page/Screen » Landing page + query string:
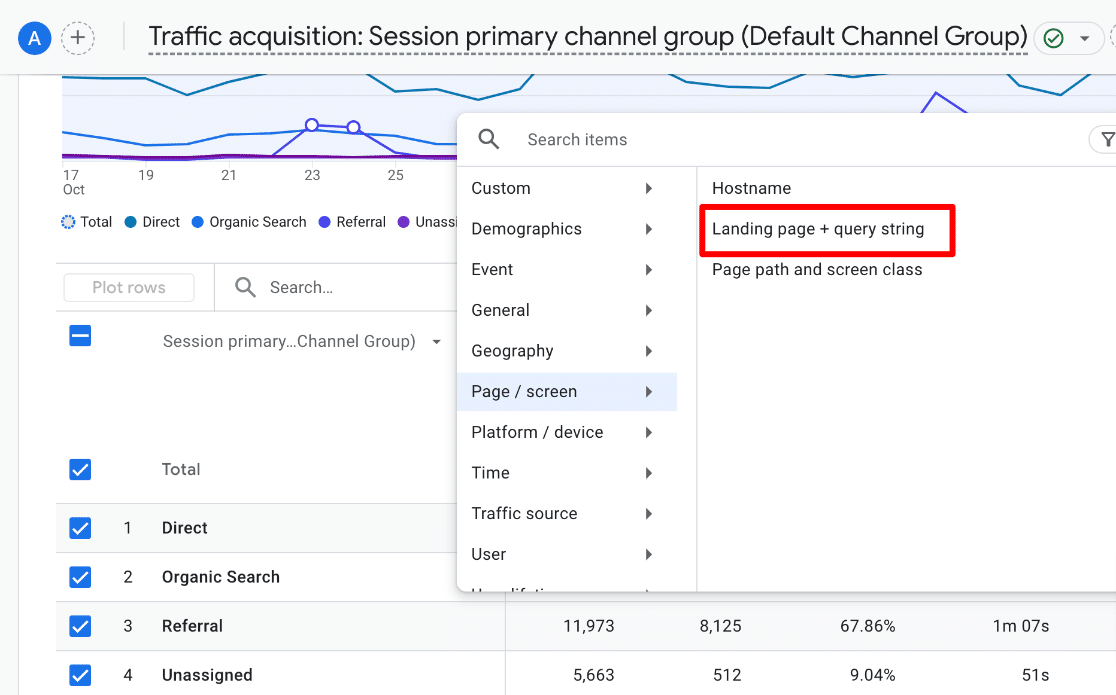
Finally, to isolate your organic traffic, type “organic” into the search bar:
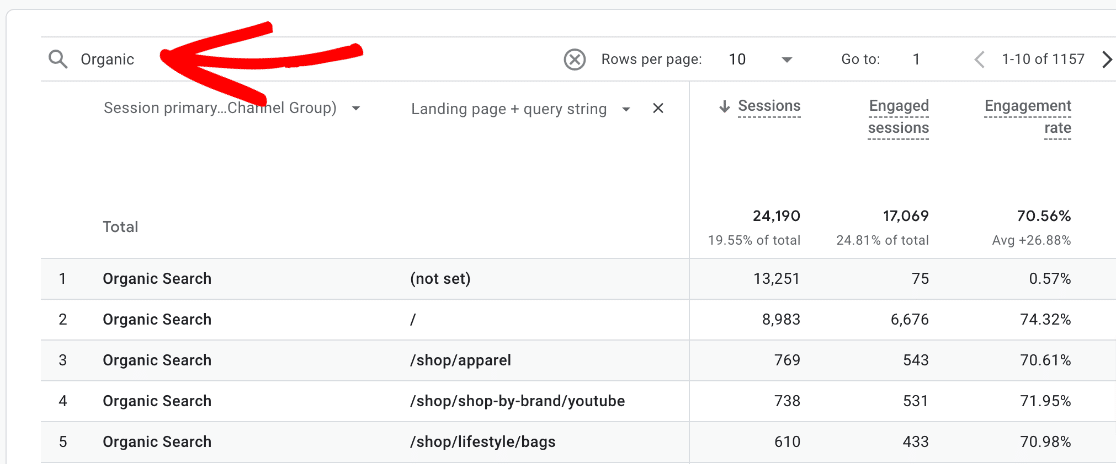
Now, you’ve got a report of your top organic landing pages. Which ones can you find that need help with engagement or conversions?
You can add dimensions like this to just about any standard Google Analytics report! Get creative, give it a try, and see what kind of helpful data you can uncover.
2. Using Segments
This is where things get really interesting! Segmentation is like having a special lens that lets you look at specific groups of your audience. Want to know how returning visitors behave differently from new ones? Or how mobile users interact with your site compared to desktop users? That’s exactly what segments let you do.
Some of my favorite segments to use are:
- People who visited your site more than once in a month
- Visitors from specific geographic areas
- Users who completed a specific action (like signing up for your newsletter)
- Visitors who landed on the home page
Google Analytics 4 comes with some pre-made segments, but you can also make your own. To see your segments and/or create one, head to Admin » Segments:
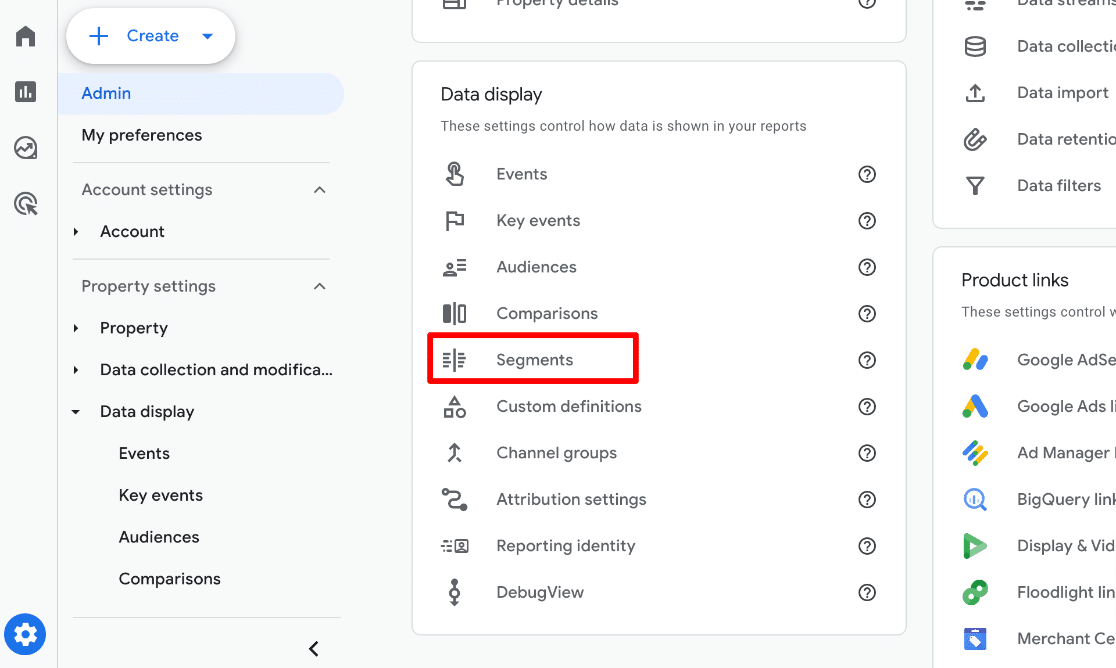
Then, click the blue New Segment button:
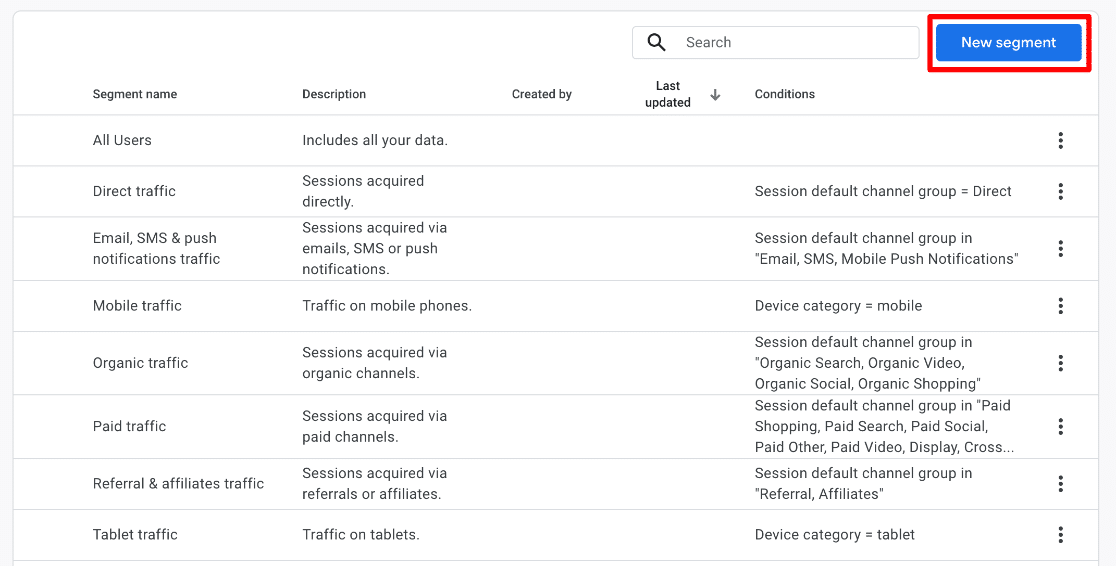
On the next page, you’ll be able to build and customize your new segment by adding certain users or sessions. For more instructions on building those custom segments, check out Google Analytics 4 Segments: Beginner’s Guide.
3. Adding or Removing Metrics from Standard Reports
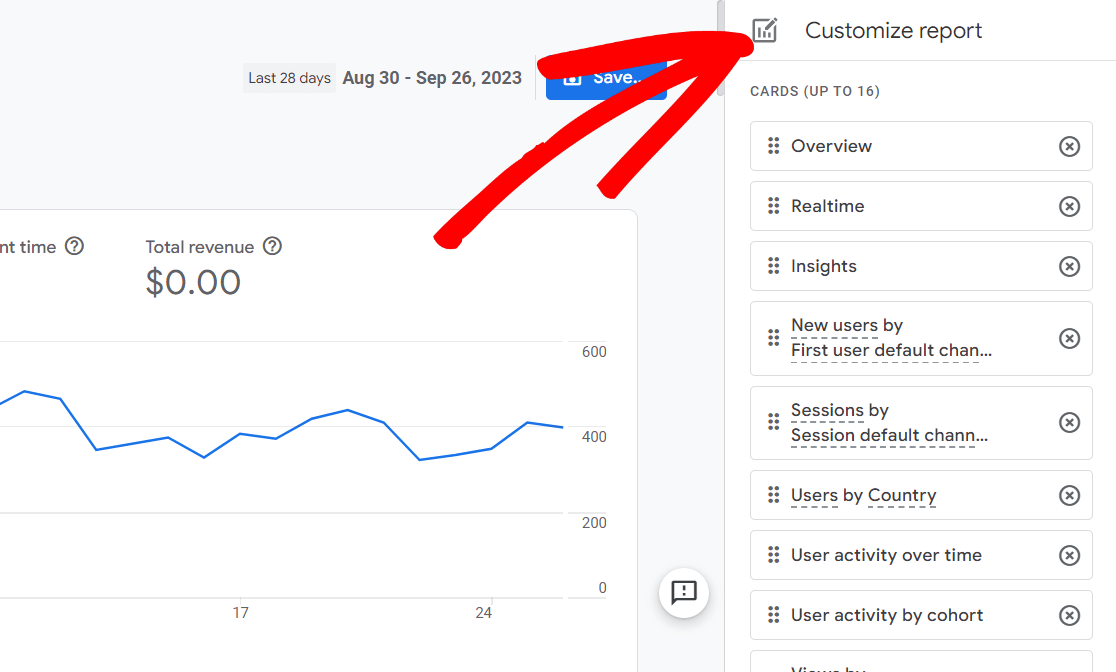
You can edit your standard reports to customize them for your business. For example, if you’re not an eCommerce business, you can remove the Total Revenue metric from your Traffic Acquisition report.
To change which metrics appear in your reports, visit the report you wish to edit and click on the pencil icon in the upper right:
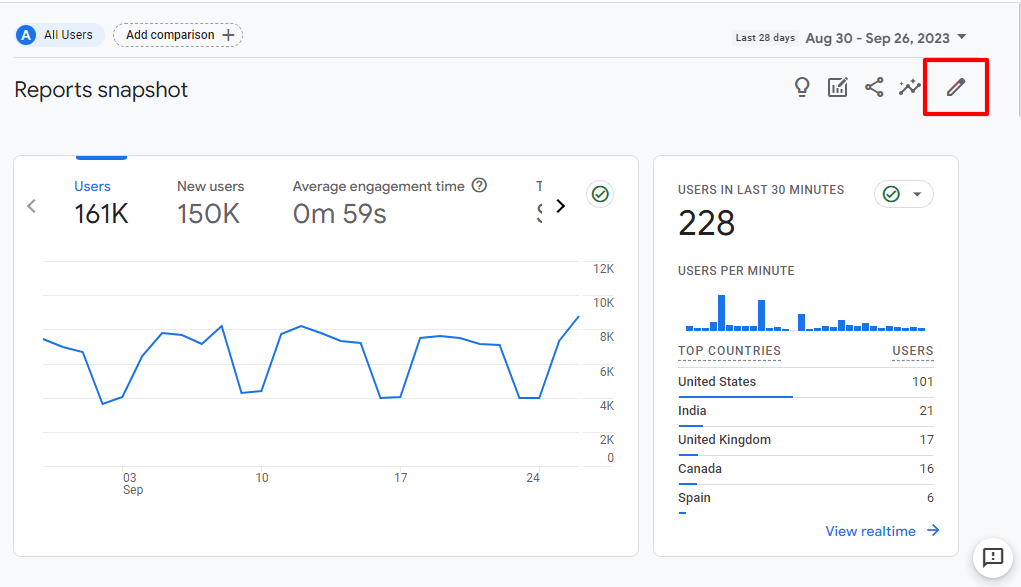
Now, you can add or remove cards from your report and add or remove metrics from the table card:
For more on customizing your dashboards, check out How to Create GA4 Dashboards (Step by Step).
Advanced Google Analytics Reporting: Explore Reports
Now, let me show you a really powerful feature in GA4 that goes beyond the standard reports. This is where things get exciting because you can dig deeper and create custom reports that tell you exactly what you want to know about your site’s performance. These reports will stay how you make them, so it’s not like just adding a dimension to a standard report.
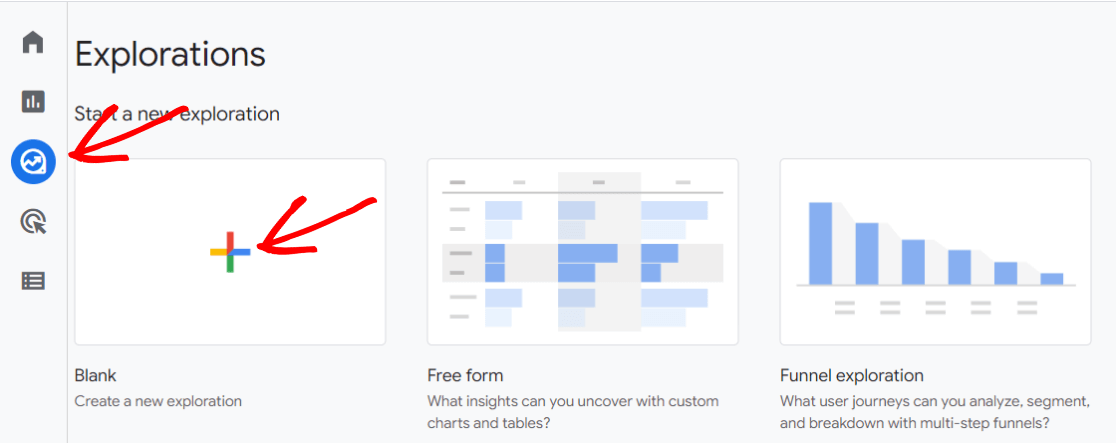
I absolutely love Exploration reports because they give you the freedom to build your own custom reports. You can drag and drop different metrics and dimensions to create exactly the view you need. Want to see how specific landing pages are performing with engaged visitors? Or maybe track how users move through your conversion funnel? You can do all that and more.
To get started, go to the Explore tab and then choose to start with a Blank report.
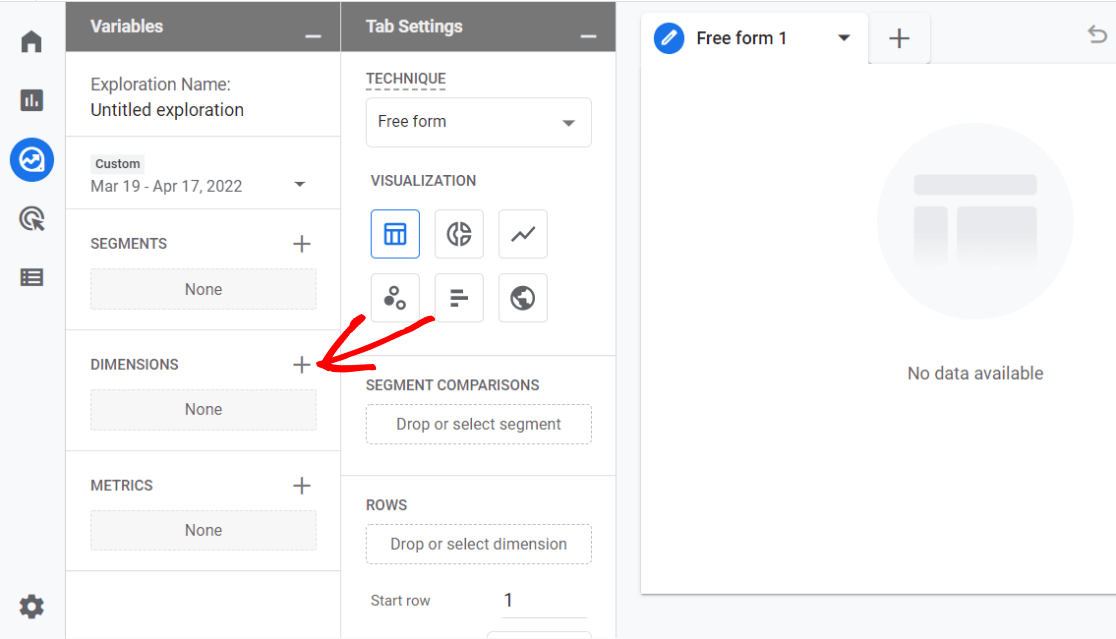
Now is the fun part: adding dimensions and metrics to create the report you want. Click on the plus signs to add dimensions, metrics, and any segments, then move them over to your rows (dimensions) and values (metrics).
For a full tutorial on creating custom reports, check out How to Create Google Analytics 4 Custom Reports (Step by Step).
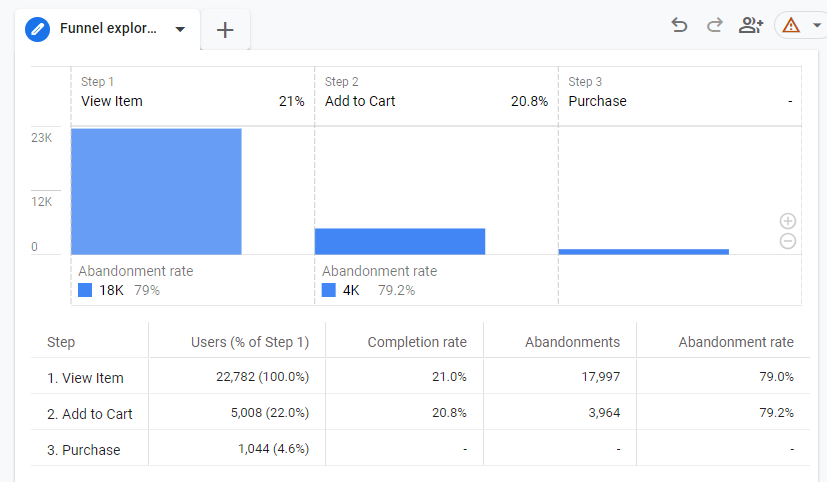
Two more types of custom reports you can create in the Explore tab are Funnel and Path Analysis reports.
These reports show you the exact routes people take as they navigate through your site. Where do they go after landing on your homepage? At what point do they tend to drop off before making a purchase? These insights are absolutely golden for improving your user experience and boosting conversions.
A funnel report looks like this:
For instructions on building your custom funnel report, check out GA4 Funnel Exploration Reports: Beginner’s Guide.
The Path Analysis report looks like this:
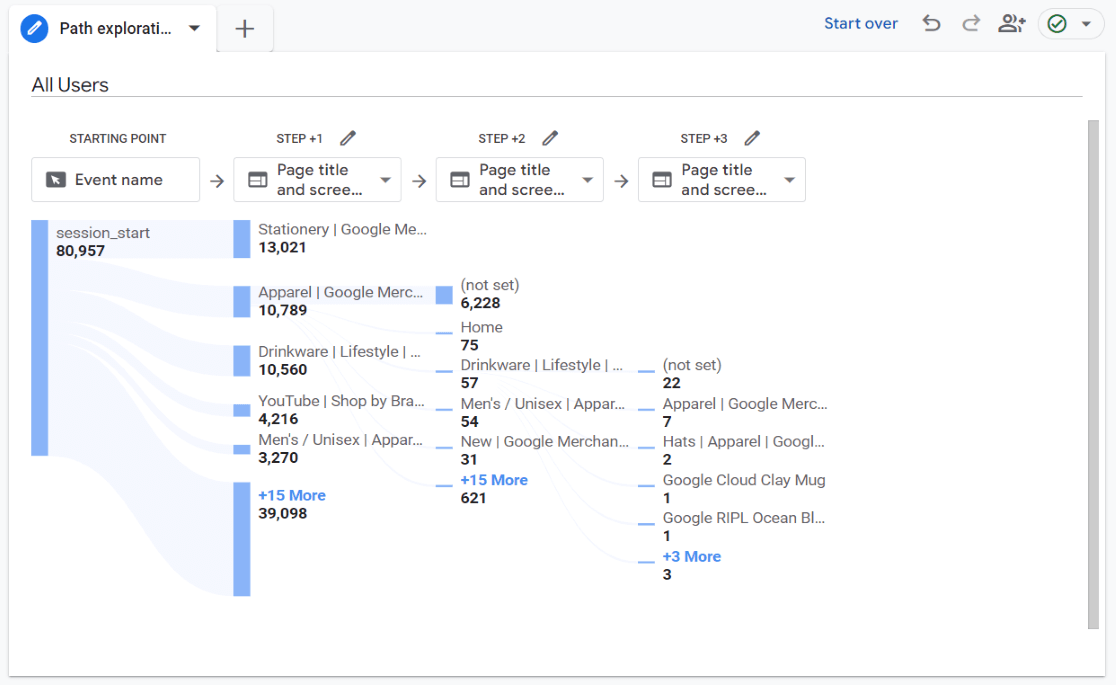
For instructions on building this report, check out How To Use the Google Analytics 4 Behavior Flow Report.
These advanced features might sound a bit technical, but trust me – once you start playing around with them, you’ll discover all sorts of valuable insights about your website that you never knew existed. They’re really powerful tools for making data-driven decisions to grow your business.
Best Practices and Tips for GA4 Reporting
Let’s face it: Google Analytics 4 can be overwhelming at first. But don’t worry! I’ve got some tried-and-true tips to help you make the most of your GA4 reports. Trust me, once you get the hang of these best practices, you’ll be analyzing data like a pro in no time.
Focus on What Really Matters
First things first: don’t get lost in the sea of metrics GA4 offers. It’s easy to get distracted by all the shiny numbers, but not all of them are equally important for your business. Here’s what I like to do:
I sit down and think about what really matters for my website. Am I trying to boost engagement? Increase conversions? Once I’ve got my goals clear, I zero in on the metrics that align with those objectives.
For example, if I’m really focusing on ramping up user engagement, I’ll keep a close eye on metrics like:
- Average engagement time
- Engaged sessions per user
- Event count per user
Remember, it’s not about tracking everything—it’s about tracking the right things.
Make Regular Check-ins Your New Habit
The real power of GA4 comes from consistent usage monitoring. Plan to check on your key reports at least weekly, with a more in-depth review of the metrics that matter the most on a monthly basis.
Why is this so important? Well, it’ll help you spot trends early on. For example, you might suddenly notice that your engagement rate is slowly declining or a particular page is suddenly getting a lot more traffic. By catching these trends early, you can adjust your strategy before small issues become big problems and/or take advantage of the increased popularity of certain pages.
Pro tip: Set calendar reminders for your GA4 check-ins. Trust me, your future self will thank you!
Key Events: Spotlight on What Matters Most
Last but definitely not least, let’s talk about key events. In GA4, these are your VIP metrics, or the ones that directly relate to your business goals.
What are the most crucial actions users can take on your site (like making a purchase, signing up for a newsletter, or submitting a contact form)? These actions should be set up as key events (conversions) so that they’re easy and convenient for you to monitor.
Marking these crucial interactions with your website as key events gives them special treatment in GA4.
They’ll show up more prominently in your reports, making it easier to track your site’s effectiveness at driving real, meaningful conversions.
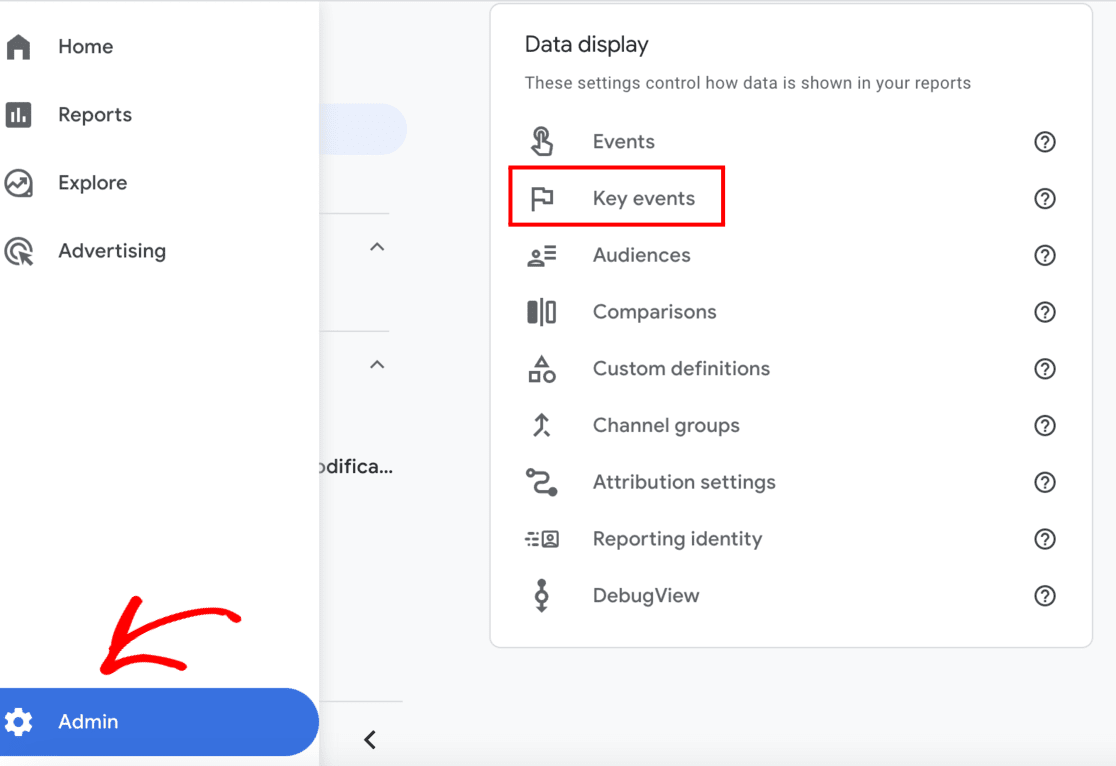
To mark events as Key Events, head to Admin » Key Events:
Then, click the toggles on the event(s) you want to choose to mark a conversion:
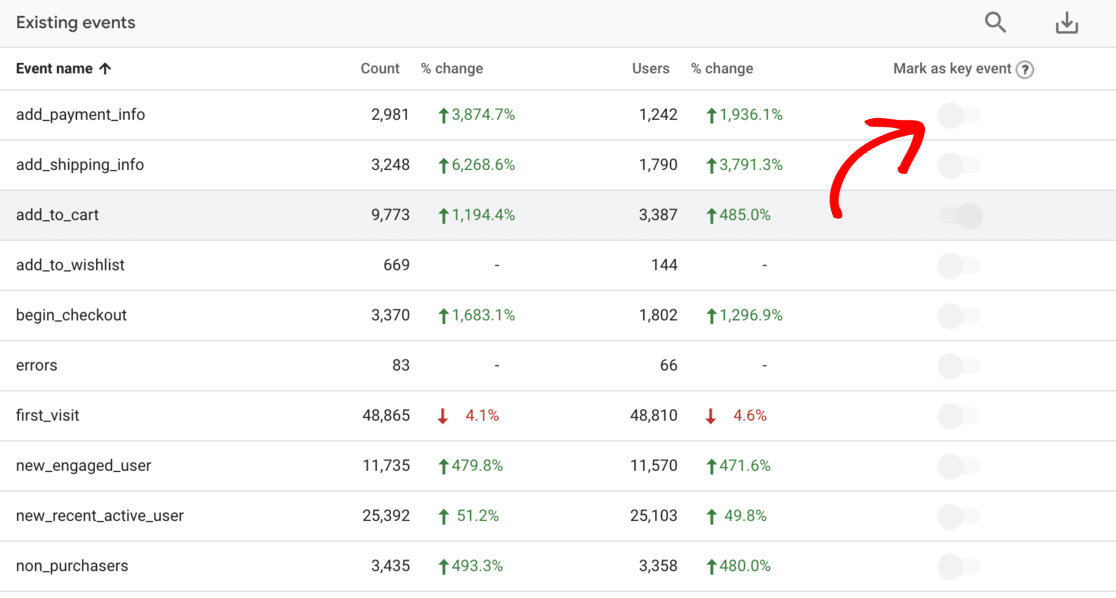
Remember, not every event needs to be a key event. Be selective and focus on the actions that truly indicate success for your business.
Don’t see an event in the list that you want to track as a conversion? If you’re using WordPress, try checking out A Complete Guide to GA4 Conversion Tracking for WordPress.
Speaking of WordPress, let’s take a look at the best way to set up Google Analytics on a WordPress website.
Google Analytics Reports in WordPress
If you love the flexibility and ease of WordPress, I’ve got some great news for you: MonsterInsights can help you install and set up Google Analytics reporting on your website.
Let me tell you why I’m such a fan of MonsterInsights and how it can revolutionize the way you handle your GA4 reporting.
Bringing GA4 Data Right to Your WordPress Dashboard
MonsterInsights puts all of your most important Google Analytics reports inside your WordPress dashboard. No more jumping back and forth between platforms or getting lost in the GA4 interface. It’s all right there, where you’re already working.
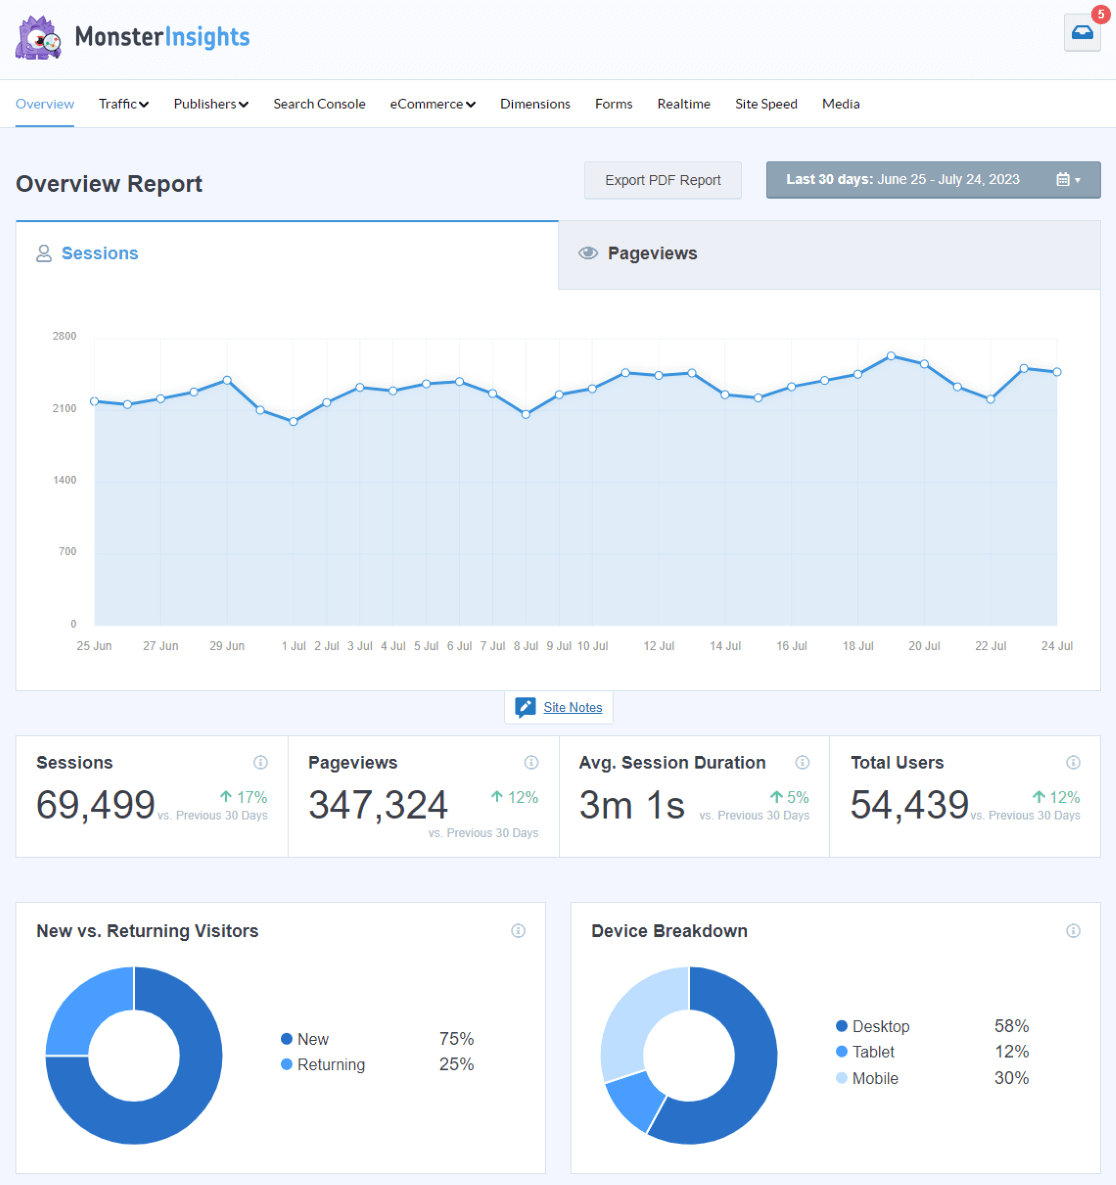
But it’s not just about convenience (though that’s a big plus). MonsterInsights takes all that complex GA4 data and presents it in easy-to-read reports that are specifically tailored for WordPress users. Once you see how simple it makes everything, you’ll wonder how you ever managed without it!
MonsterInsights takes all those complex metrics and turns them into clear, actionable insights.
You get all kinds of different reports, like:
- Campaigns
- Top landing pages
- Audience demographics and interests
- eCommerce tracking (if you’re running an online store)
- Form submissions
- Social media traffic
- Search Console keyword rankings
- Video clicks
- And much more
Another thing I love about MonsterInsights is how it simplifies the whole process of setting up GA4 on your WordPress site. No need to mess around with code or worry about whether you’ve placed the tracking script correctly. MonsterInsights handles all of that for you with just a few clicks.
Plus, it makes it super easy to set up advanced tracking features like:
- Form tracking
- eCommerce tracking
- Author tracking
- Outbound link tracking
- Video interaction tracking
- SEO focus keyword tracking
- Search Console integration
- Meta pixel installation
- PPC ad tracking
These are all things that can be pretty tricky to set up in GA4 on your own, but MonsterInsights makes them a breeze.
At the end of the day, what MonsterInsights does is empower you to make data-driven decisions about your website without needing to become an analytics expert. You can easily see what’s working, what’s not, and where your opportunities for growth are.
Whether you’re trying to increase your traffic, improve your content strategy, or boost your conversions, MonsterInsights gives you the insights you need, right when and where you need them.
Get started with MonsterInsights now.
That’s it!
I hope this Google Analytics reports guide helped you get a handle on what all of the reports do and how you can use them to grow your business.
If you liked this article, you might also want to check out:
User Behavior Analytics: Tools, Key Metrics & More
Search Console Insights: 6 Powerful Reports to Boost Your SEO
From Reports to Results: A WooCommerce + MonsterInsights Case Study
10 Best Ways to Measure SEO Performance in Google Analytics
Finally, don’t forget to follow us on YouTube for more helpful reviews, tutorials, and Google Analytics tips.
Google Analytics Report FAQ
What is Google Analytics 4 (GA4)?
Google Analytics 4 is the latest version of Google’s web analytics platform. It’s designed to provide a more comprehensive view of user behavior across websites and apps, using event-based tracking and machine learning to offer deeper insights into user journeys.
What are the key reports in GA4?
Some of the key reports in GA4 include the Acquisition Overview, Engagement Overview, Monetization Overview, and Retention reports. GA4 also offers powerful features like Exploration reports, which allow for more in-depth data analysis.
How can I set up custom events in GA4?
To set up custom events in GA4, you can use the Events section in the Configure menu. Here, you can create new events based on existing ones or define completely new custom events. You can also use Google Tag Manager for more complex event tracking.
What’s the difference between events and conversions in GA4?
In GA4, events are any interactions or actions users take on your website or app. Conversions are specific events that you’ve marked as particularly important to your business goals, such as purchases or sign-ups.
How can I improve my Google Analytics reporting skills?
To improve your GA4 reporting skills, start by familiarizing yourself with the platform’s interface and key metrics. Regularly review your data, experiment with different report types, and consider taking Google’s free Analytics Academy courses. Tools like MonsterInsights can also help simplify the process and provide actionable insights.
Can I use GA4 with my WordPress site?
Yes, you can use GA4 with WordPress. While you can manually add the GA4 tracking code to your WordPress site, using a plugin like MonsterInsights makes the process much easier and provides additional features tailored for WordPress users.
How often should I check my Google Analytics reports?
The frequency of checking your reports depends on your needs, but a good practice is to do a quick daily check for any significant changes, a more thorough weekly review, and a comprehensive monthly analysis. This helps you stay on top of trends and quickly identify any issues or opportunities.

